The ACD says how many. Nobody says why.
Queues and dispositions show that volume moved; the reason is inside thousands of recordings no one can search. Forecasts, IVR menus and self-service get built on a guess.
Your telephony platform counts the calls. Ender Turing reads them: every call, chat and email is transcribed, categorized and measured the moment it ends, so the reasons behind the volume, the repeat contacts hiding in the averages and the minutes lost inside calls reach operations the same day — on a board, in a scheduled report, or as an automation. In any language, without an analyst in between.
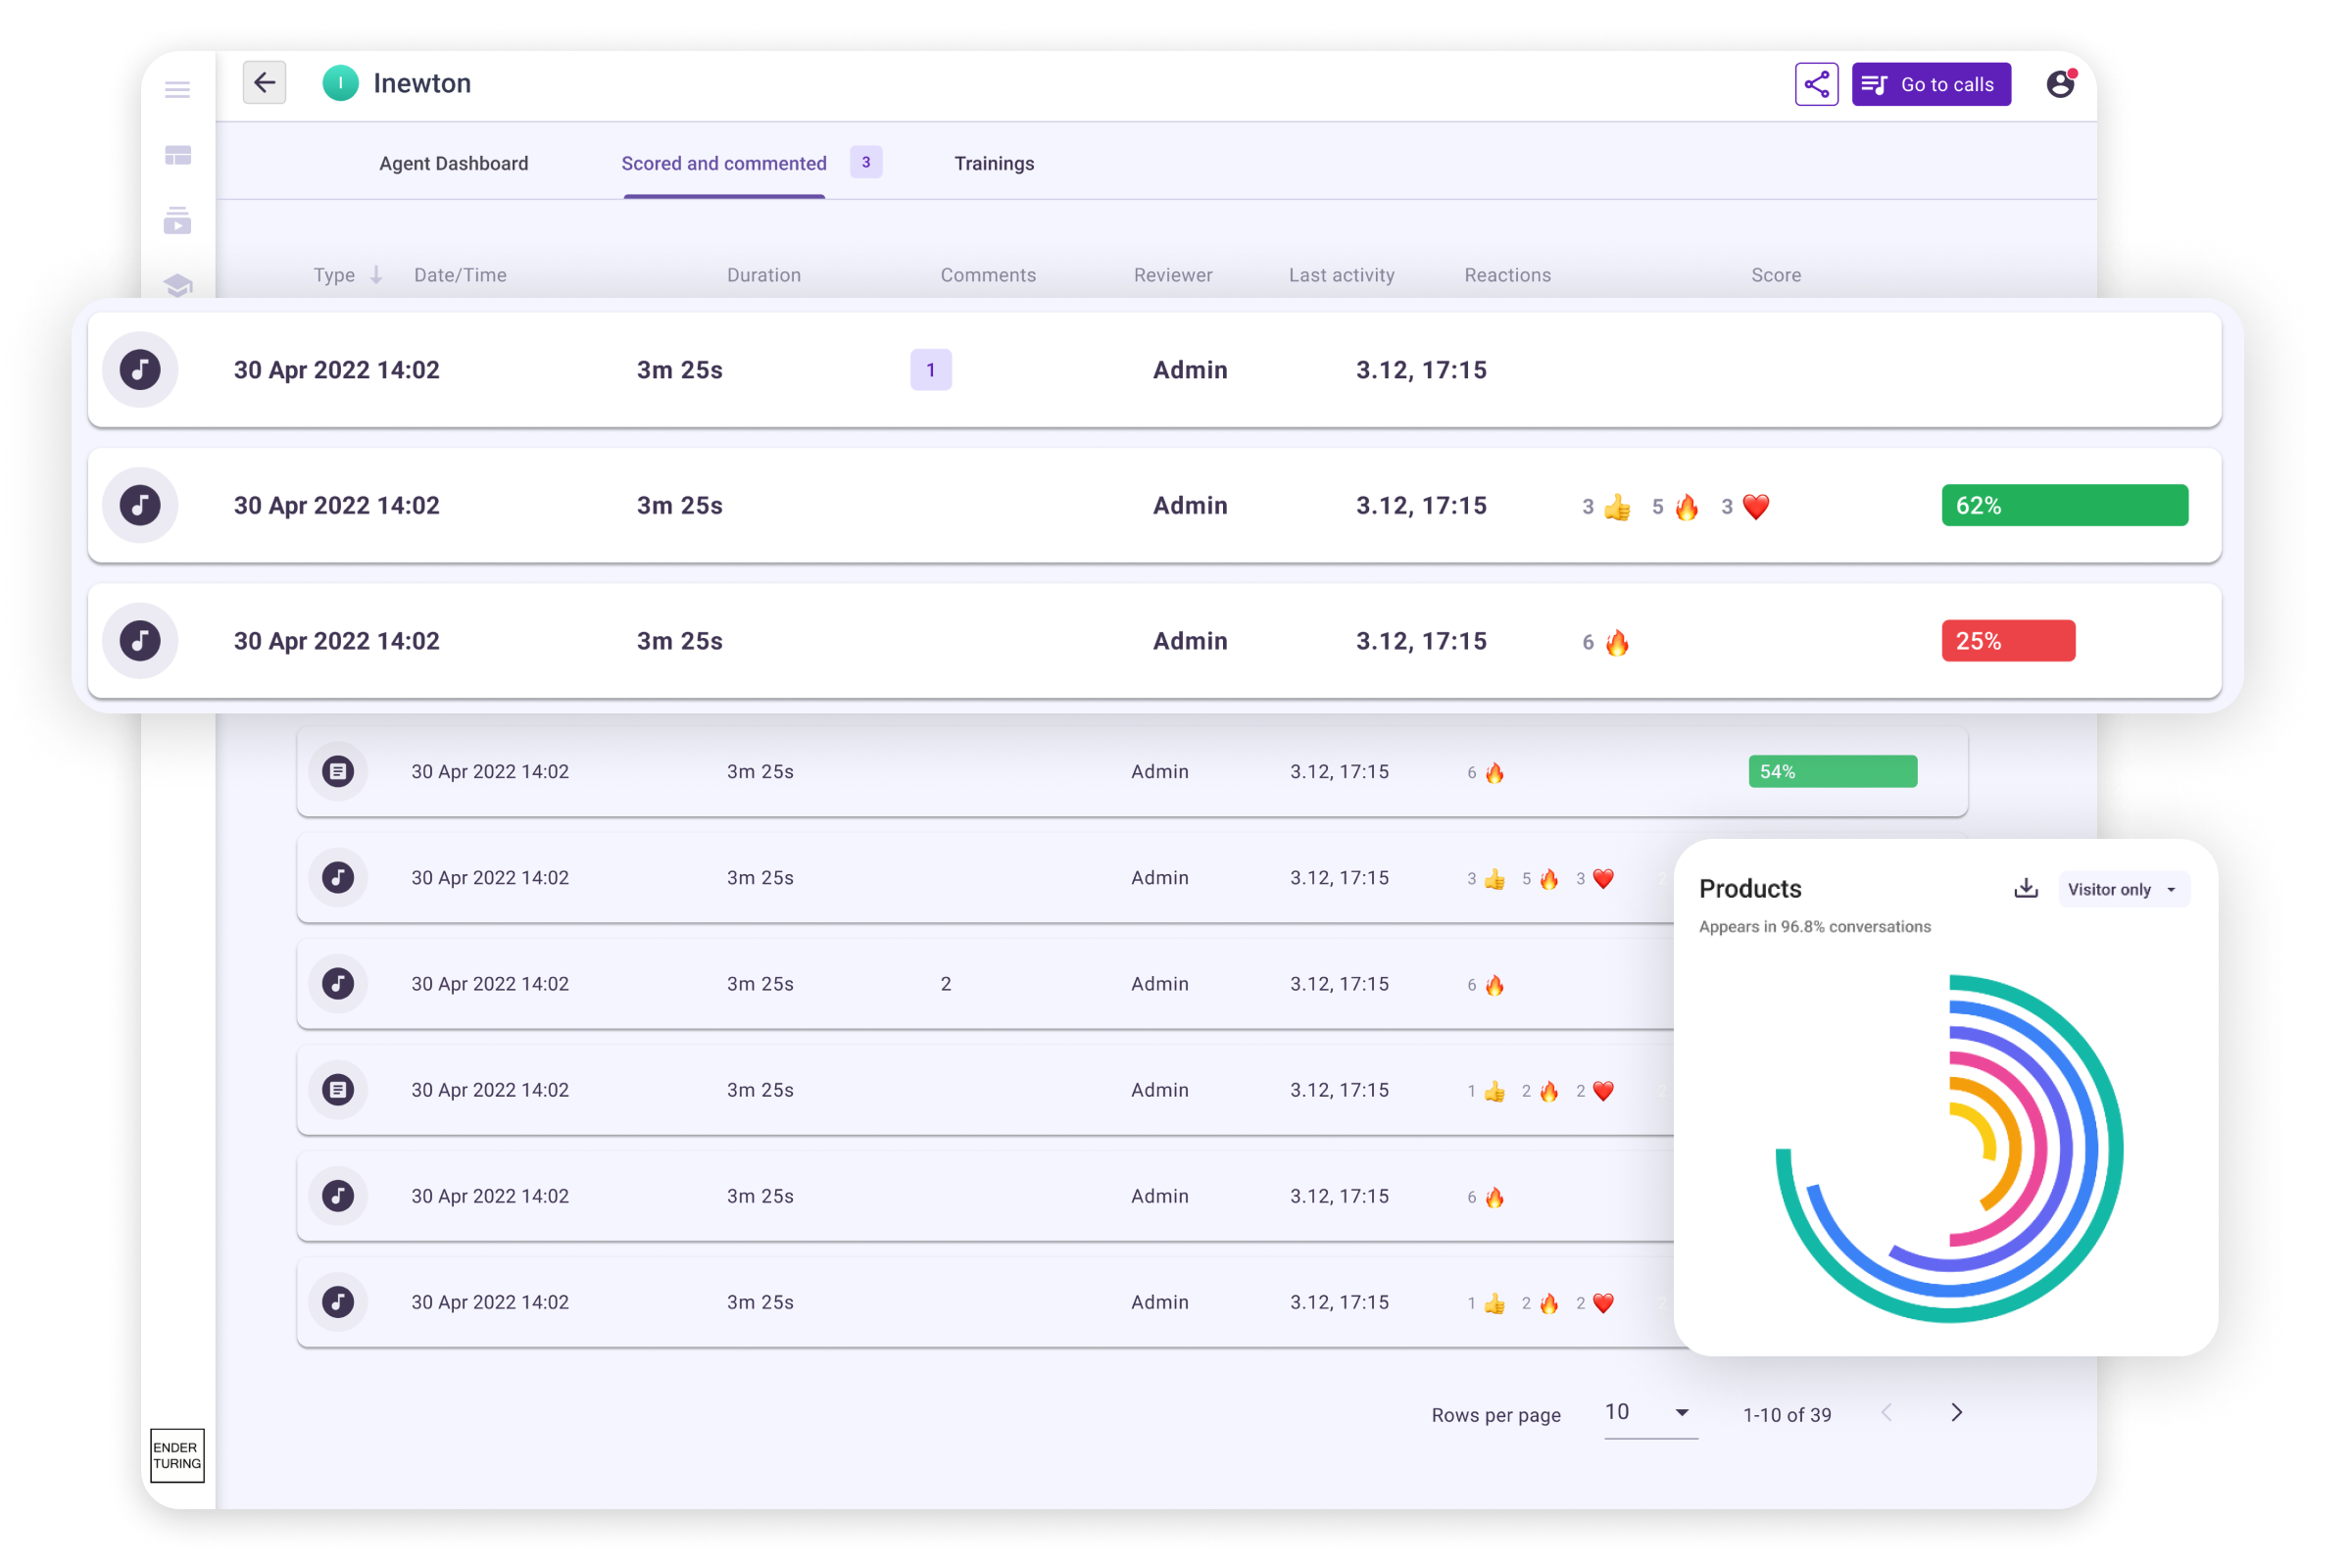
Queues and dispositions show that volume moved; the reason is inside thousands of recordings no one can search. Forecasts, IVR menus and self-service get built on a guess.
A customer who calls three times about one unresolved issue counts as three handled calls. First contact resolution comes from a survey few customers answer — weeks later.
Exports, spreadsheets, a deck by Friday. By the time the board reads it, the week it describes is over — and the next question needs another export.
Contact-center templates are installed on sign-up; executive boards and scheduled reports come with the Business plan.
Every conversation is categorized by topic — generative AI, rules or your labels — so the reasons behind a volume spike are a chart, not an assumption. Group by topic, queue, CRM status or customer; keep the top N.
Your rules decide what counts as a repeat contact — same customer, same queue, how the previous call ended — and every conversation carries the interval to the previous one. First contact resolution comes from the values in your data, not a survey.
Average duration, agent-to-customer talk ratio, silence share and cross-talk per agent, team and queue; the duration distribution of the whole floor; trend lines by day, week or month with the previous period behind them.
Executive boards combine charts, funnels, volume meters, tables and topics in one view; a scheduled email delivers the dashboard as PDF or HTML at the interval you set; any filtered set of conversations exports to Excel; the REST API feeds your BI.
If this, then that: when a conversation matches — a topic, a low score, a satisfaction drop — notify the right manager immediately or in a daily digest, add it to a review list, run AutoQA, write a summary, or send a webhook to your CRM or ticketing.
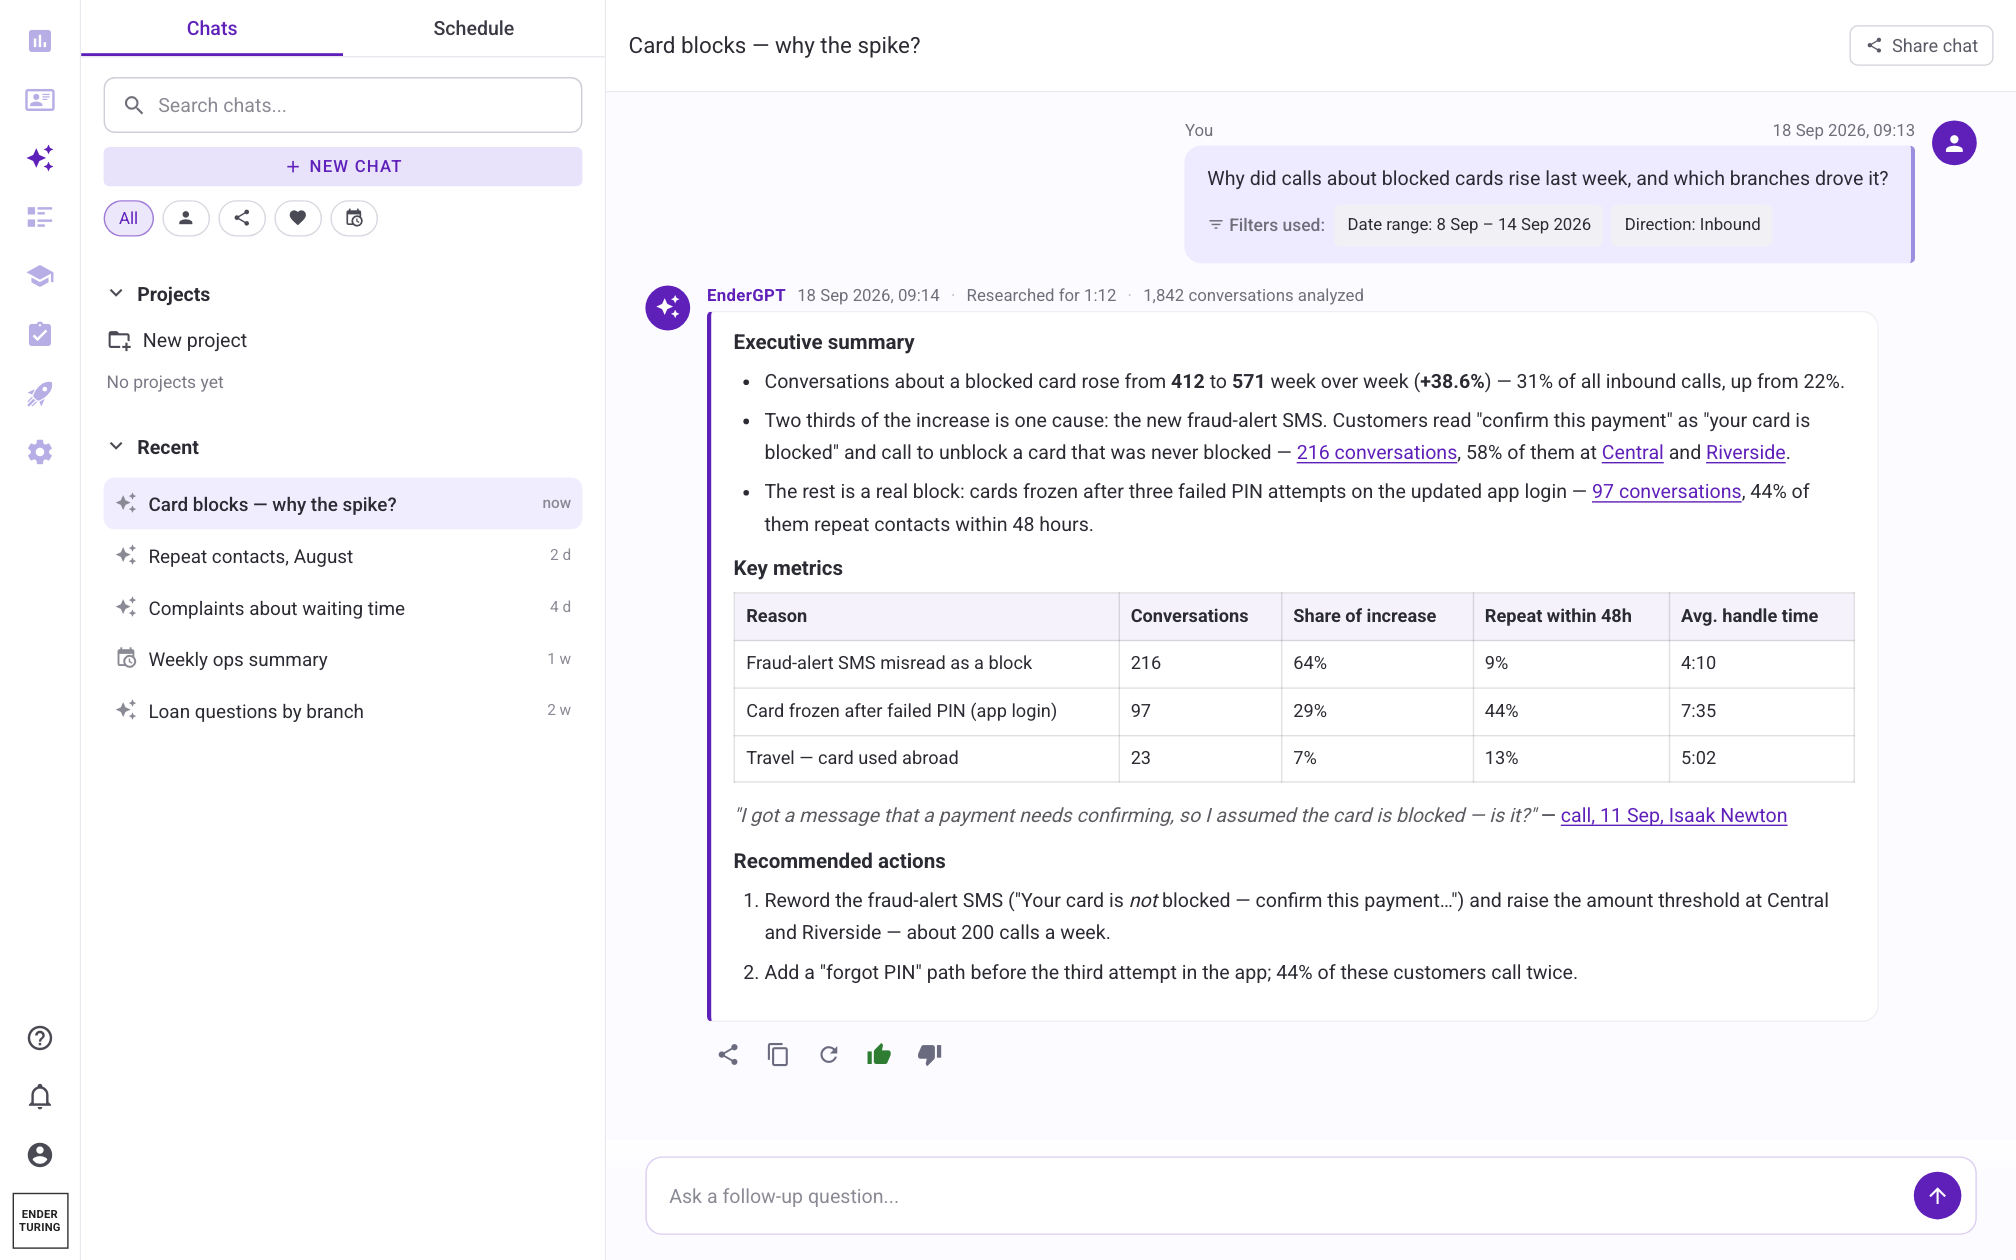
"Why did calls about payments rise last week?" EnderGPT answers from the conversations, with citations; a scheduled chat delivers the same answer every Monday. Discovery finds any phrase across every transcript and opens the exact moment.
Averages across our contact-center deployments — each customer's own numbers are in the case studies. Case studies →
Product screenshots — dashboards and analyses from the platform, not illustrations.
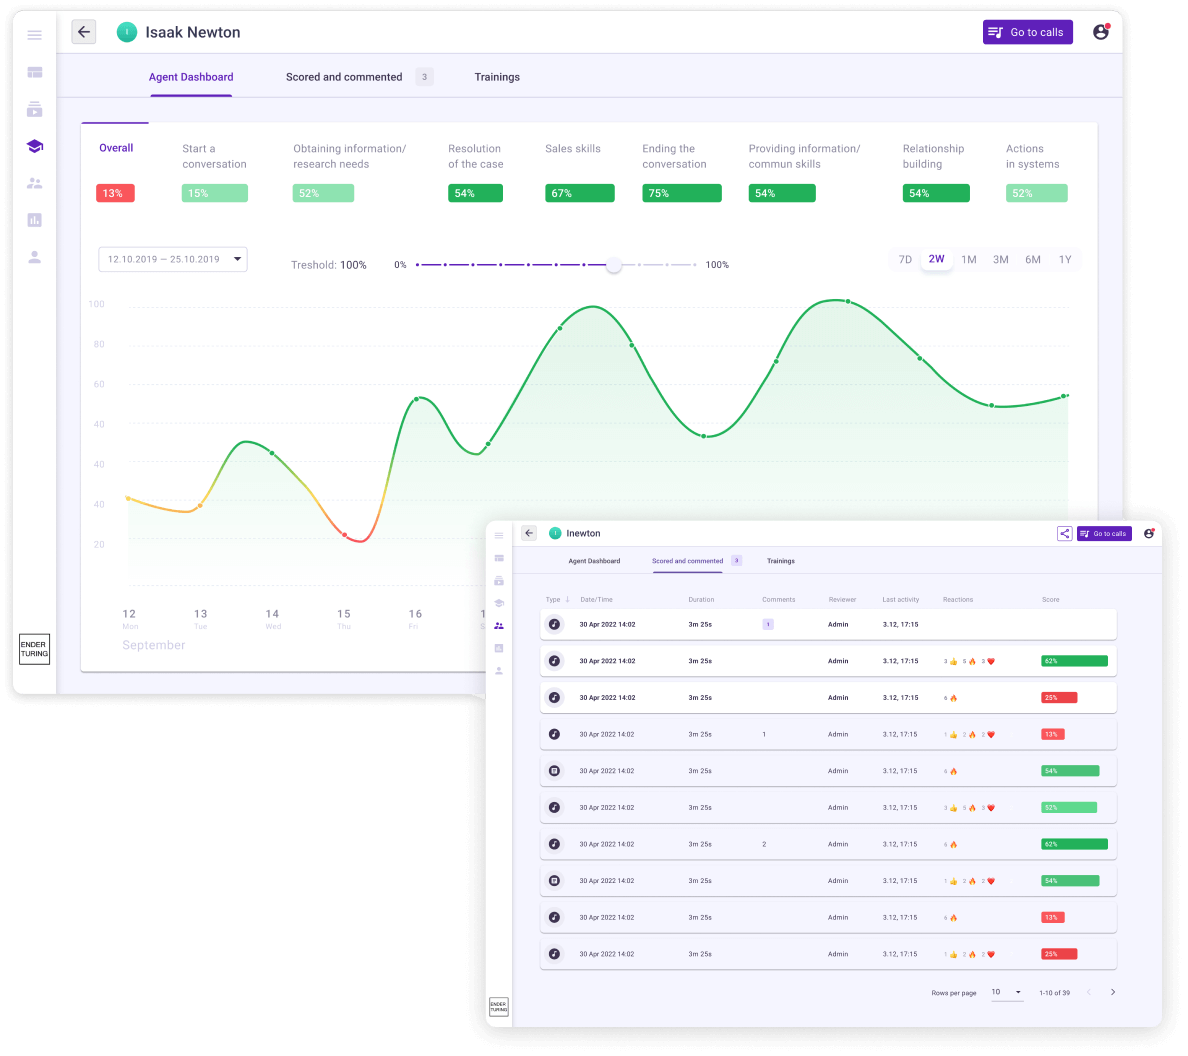
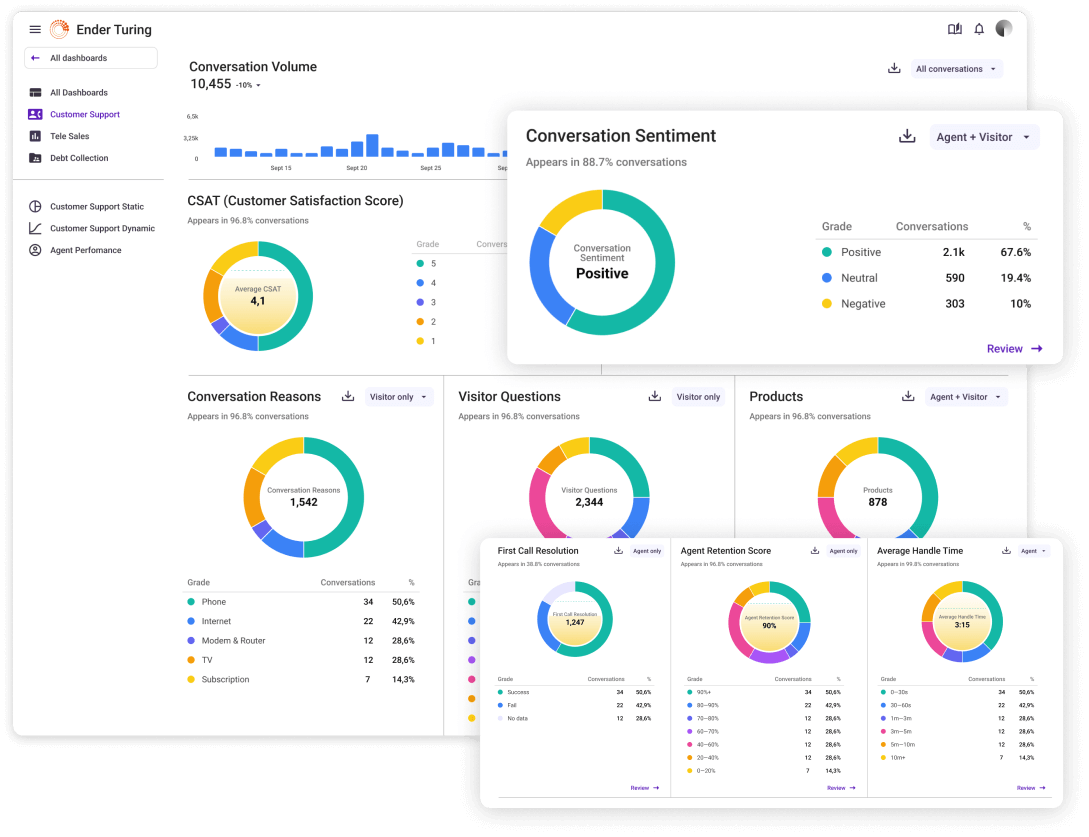
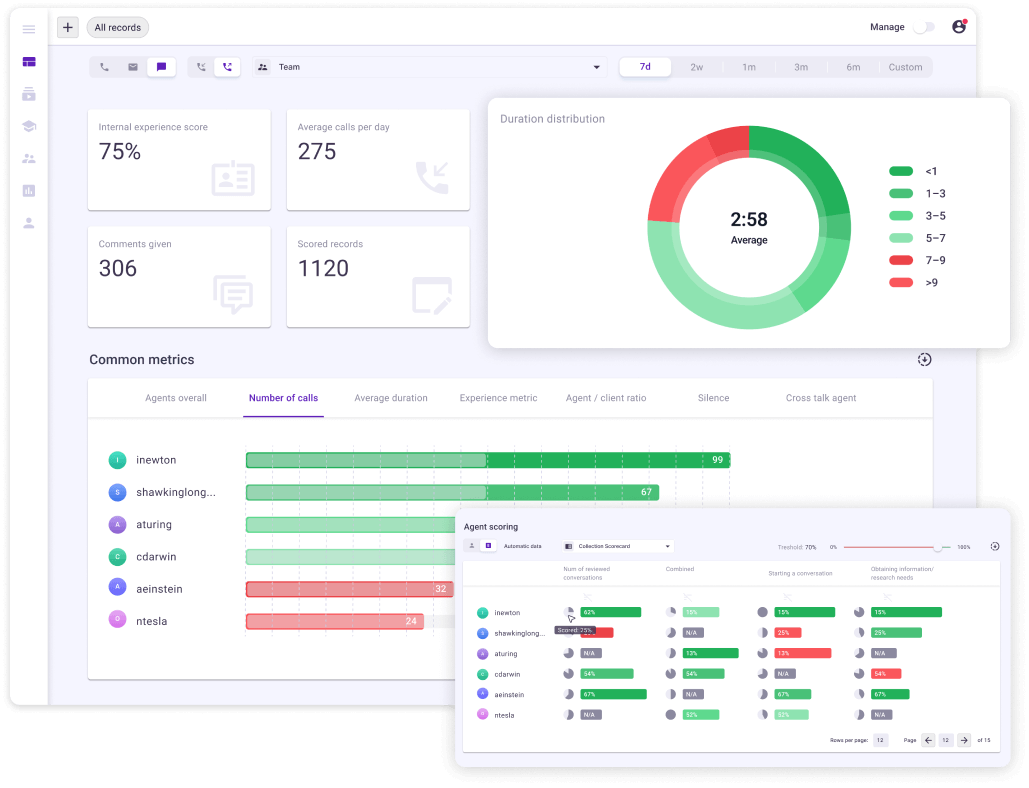
The layer under every number on this page: 100% of calls, chats and emails transcribed, categorized and measured seconds after they end.
When the reason is a skipped step, not a broken process: AutoQA on every conversation, with the accuracy measured against your reviewers.
Satisfaction at the start and the end of every conversation, interaction intensity per topic and agent — the customer's side of the operation.
It turns every call, chat and email into operations data the moment it ends: the topic (why the customer contacted you), whether it was a repeat contact, how long it took and where the silence was, how satisfied the customer sounded at the start and at the end, and whether the agent covered what the process requires. Operations managers use it to see the reasons behind volume, cut repeat contacts, find the minutes lost inside calls, and replace hand-built weekly reports with boards, scheduled reports and automations — in any language.
Topics categorize every conversation — by generative AI, by rules, or by your own labels — and appear in filters, dashboards, charts, boards and funnels. A chart grouped by topic and week shows which reason grew; grouping by queue, CRM status or customer shows where. You start from the contact-center templates installed on sign-up and adjust the categories to your business; topic accuracy is tracked so you know how far to trust the numbers.
Yes. You define what counts as a repeat contact — the same customer coming back, optionally through the same queue, after a previous call of at least a given length that ended a given way — and Ender Turing links each conversation to the customer's previous one and stores the interval between them. The Conversations view filters by that interval (for example, calls whose previous call was within four hours) and opens the whole chain. First contact resolution is read from the resolved and not-resolved values in your incoming data and is available as a chart grouping.
It is the reporting layer for what was said on the calls. Dashboards with fast filters, custom charts with formulas and benchmark lines, funnels, and executive boards that combine charts, meters, tables and topics in one view; a scheduled email that delivers the dashboard as PDF or HTML; export of any filtered set of conversations, with summaries, to Excel; and a REST API for your BI tool. The difference from an ACD or CCaaS report is the source: those count calls, queues and times; Ender Turing reports the content of the calls and joins it to the same queues and CRM statuses.
Yes — from 100% of conversations instead of the few who answer a survey. Topics show what customers contact you about and how that changes week to week; customer satisfaction is estimated from the dialogue at the start and the end of every conversation, so you see which topics, processes and agents move it; interaction intensity shows where conversations get tense; Discovery finds every mention of a product, a competitor or a phrase across all transcripts. Automatic summaries and EnderGPT turn thousands of conversations into an answer the product or process owner can act on.
Your telephony platform reports how many calls arrived, how long they waited, how long they took and where they were routed. It does not know what was said. Ender Turing reads the conversation itself — the reason, the repeat contact, the silence, the promise, the satisfaction — and groups it by the same queue names and CRM statuses your platform already sends, so the two views line up. Keep the platform report for capacity; use Ender Turing for the why.
Compare on the same things you would compare any operations tool on: how many conversations are covered (Ender Turing analyzes 100%), how fast a new floor gets numbers (a workspace in minutes with contact-center templates and auto-scoring from the first calls; implementation engineers on the Business plan), who runs it day to day (an operations manager with EnderGPT and scheduled reports, not a program team), the languages it covers (any language, with others added on request), and the price per agent — free for up to five agents, then $39 or $79 per agent per month, published on the pricing page.
Documented apps for Genesys Cloud, Five9, Zendesk, GoHighLevel and Fireflies; the Ender Turing browser extension, which records calls on 18 browser-based CRM and dialer platforms; the REST API, SFTP and manual upload for everything else; and on the Business plan, connectors to recording systems and a CRM connector that carries statuses and metadata both ways — set up by our engineers. Nothing is written back to your telephony platform.
No. The Templates Library installs contact-center bundles of boards, charts, topics, tags, scorecards, funnels, automations and prompts; the operations manager adjusts them rather than building from zero. Questions that used to need an export go to EnderGPT in plain language and come back with citations; the recurring ones become scheduled chats and scheduled reports. Analysts, where you have them, get the REST API and the Excel export.
The free plan gives you a workspace in minutes; connected or uploaded conversations are analyzed as they arrive, so the first dashboards fill the same day. Contact centers on the Business plan get dedicated implementation engineers, recording-system connectors; auto-scoring starts from the first calls.
Free for up to 5 agents — 100 calls per agent a month, calls up to 10 minutes, standard templates, dashboards, topics, the repeat-contact view, automations and EnderGPT — and it does not expire. Team is $39 per agent per month with no limits, custom charts, built-in satisfaction and intensity analysis, scheduled chats, data export and the REST API. Business is $79 per agent with executive boards, scheduled reports, connectors set up by our engineers, the CRM connector; auto-scoring starts from the first calls. Enterprise adds private cloud or on-premise deployment.
Any language. Production speech recognition today covers English, Spanish, Portuguese, French, German, Polish, Ukrainian, Arabic, Chinese, Japanese and more; a language we do not run yet is added on request or connected through your own speech-recognition engine. SOC 2 Type II and GDPR-compliant data handling on every plan; PII masking in transcripts on Business; private cloud (AWS, GCP, Azure) or on-premise deployment on Enterprise.
Security, hosting regions, sub-processors and response times are documented on the Data Security page; SOC 2 Type II examination completed.
Book a demo with your own recordings, or start free and connect the floor yourself: the first boards fill the same day.