Picture a telecom CFO who opens every quarterly review with the same slide. It shows contact center spend, headcount, and a single word underneath: “Optimize.” For fourteen quarters in a row, that word has meant “cut.” Meanwhile, the same building closes renewals, upsells, and cancellation saves that never touch the operations P&L. Nobody makes the call center profit center argument because nobody has a slide that says it is one.
This is the quiet reason contact center ROI conversations die. The revenue exists. The math exists. It just lives in the wrong spreadsheet.
Why Boards Still See The Contact Center As A Cost Line
Ask a CFO how they see the contact center and you will hear four things: it costs about 4-6% of revenue, it has high attrition, it is hard to scale down, and its main lever is call volume deflection. That framing is not wrong. It is incomplete.
McKinsey found that inbound service call centers generated up to 25% of new revenue at some credit card companies and up to 60% at some telecom companies. Bain has shown that a 5% increase in customer retention lifts profit by 25-95%. Neither number shows up on a standard CC operations dashboard. The dashboards were designed in the 1990s to answer one question: are we handling volume within cost per call? They were never asked to answer whether the calls made or lost the company money.
Two things happen as a result. The finance team benchmarks the call center against other cost centers, which are engineered for reduction. And the CC leader spends the whole review defending headcount instead of pitching contribution. The vocabulary is trapped in a cost frame.
The reframe from cost line to revenue contributor does not require new investment. It requires new measurement. Most of the underlying data is already flowing.
The Data That Is Already In The Building
The average organization manages 3.9 different contact center technologies, according to Puzzel’s State of Contact Centres 2026. That includes the ACD, a CRM, a QA tool, workforce management, and usually two or three point solutions for coaching, sentiment, or IVR analytics. In principle every call, chat, and email is captured somewhere across those systems. In practice the data lives in silos designed for a different purpose than revenue attribution.
Here is the concrete gap. CRM notes capture only a fraction of what actually happened on the call. That is not because agents are lazy. It is because after-call work is a 90-second sprint at the end of a shift, and the CRM asks for structured fields, not narrative.
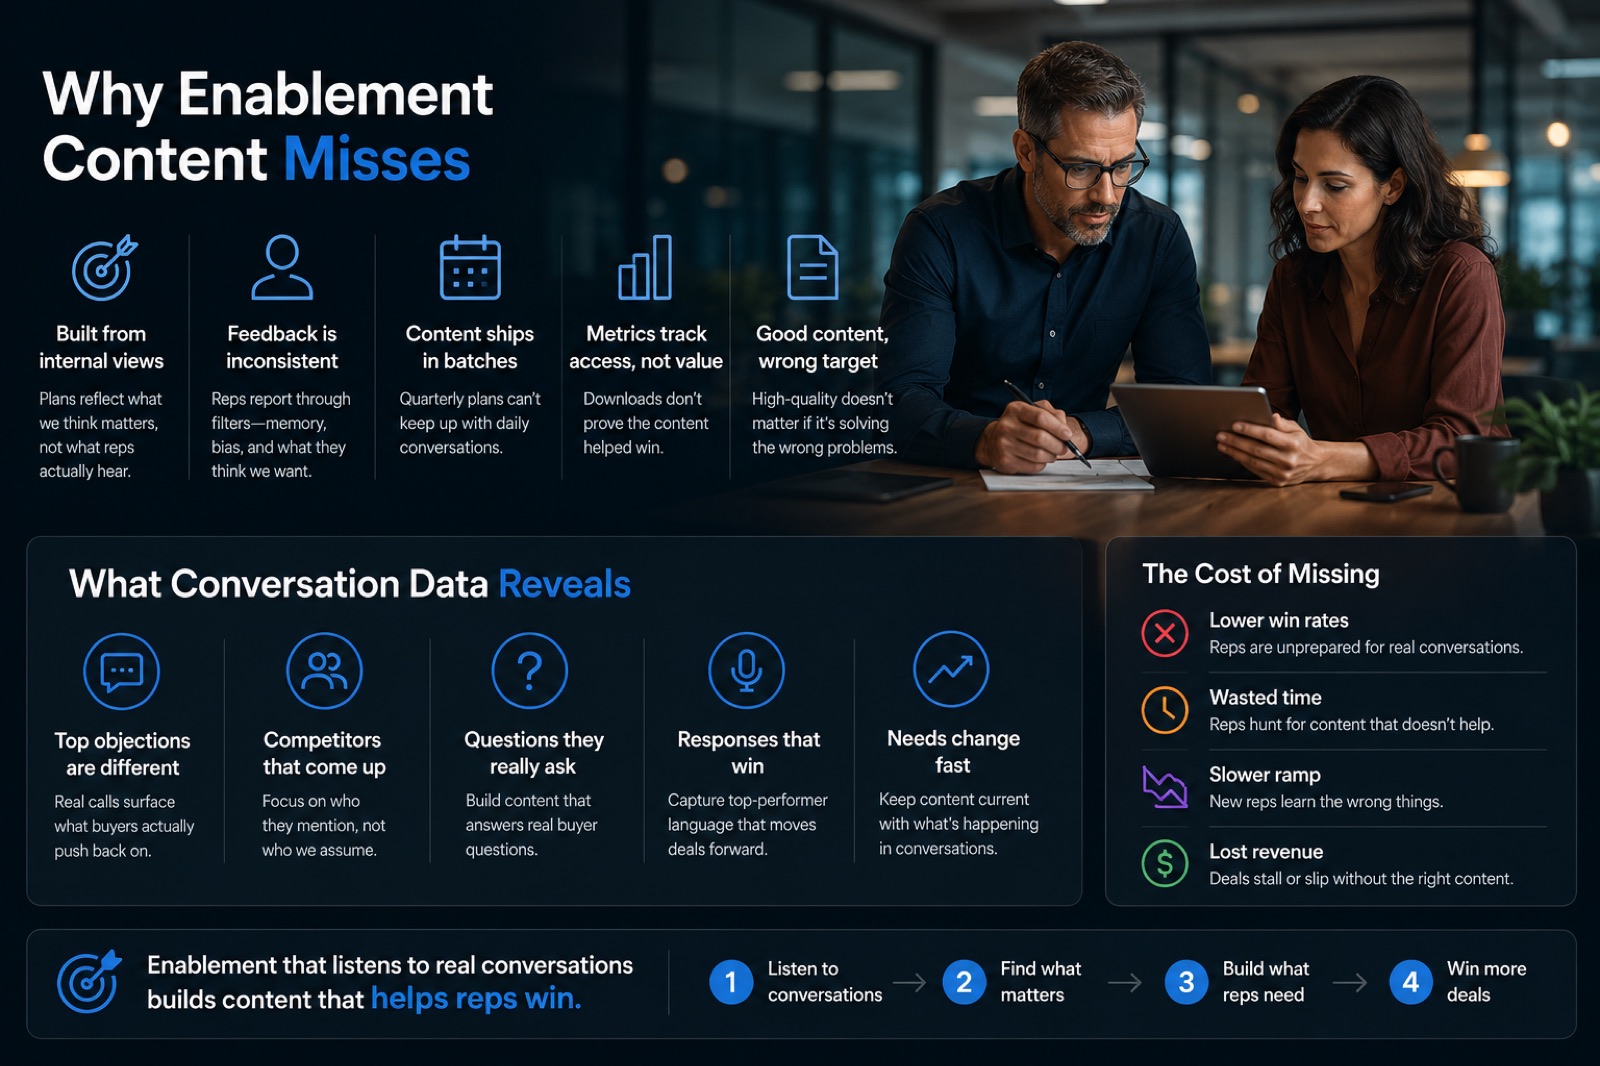
Conversation intelligence closes that specific gap. Speech analytics ROI in a revenue frame is not about listening to more calls. It is about routing signals that already exist in every recording to the systems that own the revenue outcome. Churn risk goes to retention. Upsell mentions go to sales ops. Product complaints go to product. Competitor names go to marketing. None of that is a new tool. It is a new pipe.
COPC’s AI ROI research found that only 44% of contact centers report meeting their expected return from AI. The gap between deployment and monetization is where the CFO slide gets stuck.
Building A Call Center Profit Center P&L
The cleanest way to change the CFO conversation is to build a P&L that treats the contact center like any other revenue-adjacent function. Below is the structure we recommend for deploying conversation intelligence with a CFO in the room.
Revenue line 1: Retention save value. Track calls that started as cancel intent and ended without a cancel. Multiply by the customer’s annual contract value and the churn rate you would otherwise expect. Take a center with 8,200 cancel-intent calls a quarter and a 34% save rate. Even at a conservative $840 lifetime value per save, that is $2.3 million a quarter the operations report ignores.
Revenue line 2: In-conversation upsell. Count the calls where an upsell was offered, accepted, and delivered. Most CRMs capture the transaction but not the offer, so the acceptance rate looks like magic. Speech analytics reads the offer and the response in the same recording, so you can measure offer quality by agent, by product, by time of day.
Revenue line 3: Churn risk detection value. Not every dissatisfied customer calls to cancel. Many just get quieter and leave at renewal. Speech analytics can flag frustration language, competitor mentions, and drop in engagement inside routine service calls. Route those flags to retention 30 days before renewal and measure the delta against an untouched control group. This is the highest-leverage line and the one that requires the tightest closed loop.
Revenue line 4: Product signal value. Contact center calls are the largest continuous focus group any B2C business runs. A single quarter of transcripts will surface every product complaint, feature request, and pricing objection in the market. The value shows up on the product team’s P&L, not the CC’s, but it still gets attributed if the pipe is documented. When automated QA tags the complaint theme on every call, the product team can trace each change back to the calls that prompted it.
Cost line: Recovered agent capacity. Every minute of after-call work that gets automated is a minute of throughput back to the queue. At a 500-seat center, automated CRM summaries that save 10 minutes per agent per shift return about 83 hours of capacity a day, roughly ten full shifts, without hiring.
Cost line: Coaching yield. This is subtle but real. If AI QA catches issues sooner than manual sampling, coaching cycles compress. Compressed coaching cycles reduce time-to-competency for new hires, which reduces the effective cost per productive agent-hour. Model this as the coaching delta between sampled and full-coverage QA.
Add those six lines together and the picture that lands in the boardroom is not “call center costs 5% of revenue.” It is “call center contributes X to net revenue and Y in recovered capacity, at Z operating cost.”
The Attribution Problem, And How To Solve It
The most common CFO objection to the profit center reframe is attribution. If a customer called retention, kept the account, and then bought a new product three months later, whose win was it? This is the fair question that has kept the contact center in the cost column for twenty years.
Two things resolve it in practice. First, use closed-loop control groups instead of point attribution. Split flagged customers randomly into treated and untreated cohorts, hold the split for 90 days, and measure the delta. This is standard in marketing. It is rare in operations.
Second, publish half-credits. If retention saved a customer that sales later renewed, split the credit 50/50. Half-credit accounting is unglamorous but it stops the political fight over who owns the win and lets the CC show up in the revenue conversation at all.
Attribution is what buys the contact center its seat at the table.
How To Build The Call Center Profit Center Case This Quarter
You do not need a new platform to start this shift. You need three things: a data pipe, a control group, and one CFO conversation.
- Pick one revenue line and instrument it. Start with cancel-intent calls and save rate. Every ACD captures the call reason. Every speech analytics tool can flag cancel-intent language in the first 90 seconds. Two weeks of tagging, one week of measurement, one CFO meeting.
- Build a control group before you build a dashboard. Take 500 flagged churn-risk customers a month. Randomly hold 250 out of any intervention. Measure retention delta at 30, 60, 90 days. Do this before you spend anything on new tooling.
- Publish the six-line P&L internally for one quarter. Even if the numbers are directional, the format is what changes the conversation. When the CFO sees revenue lines next to cost lines under the CC banner, the “optimize” slide has to be rewritten.
- Ask the CFO one question in the next review. “If we could show contact center contribution to net revenue, would you want to see it monthly?” Most CFOs assume the data does not exist, which is why they never ask for it.
- Route one product signal outside the CC. Pick the top complaint theme from last month’s transcripts. Send it to the product owner with a customer count and three verbatim quotes. This is the fastest way to prove that CC data has value outside operations.
The reframe from cost center to call center profit center is not about being right. Contact centers are already cost lines and they will remain so on the ledger. The reframe is about adding the revenue lines that already exist in the data and letting the CFO see the whole picture for the first time. That is the slide that changes the budget review. And the data to build it is already in your recordings, waiting for someone to route it.