Inside Sales: The SDR Conversion Math Most Leaders Get Wrong
A B2B sales organization we workedwith had concluded their SDR team needed restructuring. Connect-to-meetingconversion was sitting at 1.6%, below the 2.5% target leadership had set. Twoperformers were hitting target. The rest were below. The plan was to manage outthe bottom half and rebuild.
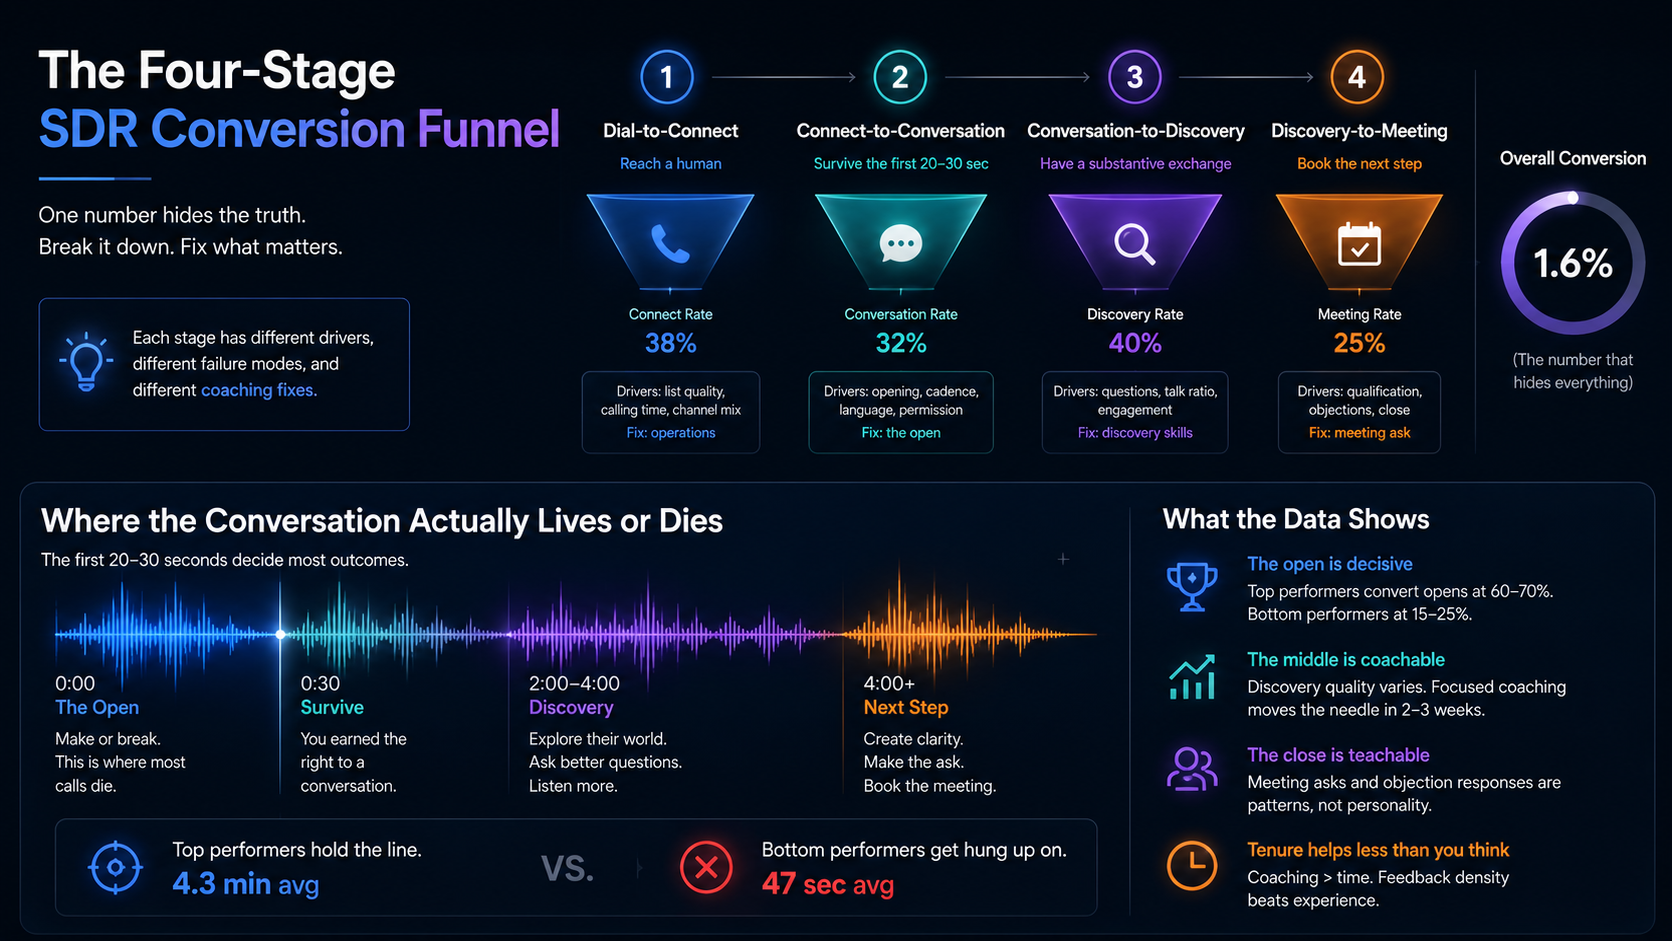
We pulled three months of their connectedcalls — the conversations where an SDR actually got a human on the line — andstratified them. The picture was completely different from the aggregate.Across the team, connect rate was healthy. The performance variance wasentirely in what happened after connect. Top performers held the prospect onthe line for an average of 4.3 minutes; bottom performers averaged 47 seconds.The 1.6% aggregate conversion was hiding the fact that some SDRs were havingreal conversations and converting at 8%, while others were getting hung up onat second 25 and converting near zero. The “underperformer” problem wasactually an “opening conversation” problem, concentrated in a fixable span ofseconds.
This is the dominant pattern in SDRperformance analysis and it’s the one most sales leaders miss. The aggregateconversion rate combines call outcomes that have completely different dynamics.The fix isn’t headcount changes. It’s the coaching that the aggregate metriccan’t see.
SDR outcomes flow through stages that need to be measured separatelyto be managed well.
Dial-to-connect. The percentage of dialsthat reach a human. Driven by list quality, calling time, and channel mix.Mostly an operations problem.
Connect-to-conversation. The percentageof connected calls that survive the first 20-30 seconds without immediatehang-up. Driven almost entirely by the opening — the cadence, the language, thepermission-asking. Highly coachable.
Conversation-to-discovery. Thepercentage of surviving calls that produce a substantive exchange. Driven byquestion quality, talk ratio, and ability to engage the prospect’s actualsituation. Coachable.
Discovery-to-meeting. The percentage ofsubstantive conversations that produce a booked meeting. Driven byqualification skills, objection handling, and clear next-step framing.Coachable.
Each stage has different drivers, different failure modes, anddifferent coaching interventions. Treating the funnel as a single conversionnumber flattens this complexity into a metric that diagnoses nothing.
When conversationanalytics stratifies SDR performance by stage, predictable patterns emerge.
The open is decisive. Most SDR variancelives in the connect-to-conversation stage. Top performers convert opens at60-70%; bottom performers at 15-25%. This single stage often accounts for themajority of total performance variance.
The middle is coachable. SDRs whosurvive the open differ on discovery quality. The variance is real but narrowerthan the open. Coaching here produces measurable returns within 2-3 weeks offocused intervention.
The close is teachable. The transitionfrom substantive conversation to booked meeting has its own dynamics. SDRs wholose deals in this final stage usually have specific patterns in how theyhandle the meeting ask — vague framing, defensive responses to “send me anemail” — that respond well to targeted coaching.
Tenure helps less than people expect.The performance gap between 6-month and 18-month SDRs is smaller than the gapbetween coached and uncoached SDRs at any tenure. The lesson is thatperformance is built by feedback density, not by time alone.
Aggregate conversion is operationally seductive — one number, easyto track, easy to compare. It’s also analytically misleading because itaverages across stages with different dynamics and different fix paths.
An SDR with a 1.2% aggregate conversion might have a 12% open rateand a strong downstream funnel — fix the open and they’re at 8% aggregate.Another SDR with the same 1.2% might have a great open and a weak discovery —completely different fix. The aggregate treats them identically and points atneither solution.
Sales leaders managing on aggregate conversion are making coachingdecisions and headcount decisions based on a metric that can’t tell these casesapart. The result is the wrong SDRs getting coached, the wrong ones gettingmanaged out, and a lot of preventable turnover in roles that could have beenfixed with stage-specific intervention.
1. Stratify your team’s conversionby stage. Connect rate, conversation rate,discovery rate, meeting rate. Each SDR has a profile, and the profile tells youexactly where they need help.
2. Listen to 5 sub-25-second hang-upsfrom a struggling SDR. The pattern in their openwill be audible. Compare to 5 same-length non-hang-ups from a top performer.
3. Calculate talk ratio on connectedcalls. SDRs who talk more than 70% in the firstthree minutes convert at materially lower rates than SDRs who get the prospecttalking earlier.
4. Identify your top three “killerphrases.” Specific openings that correlate withimmediate hang-up. They exist on your team and they’re more concentrated thanmost leaders expect.
5. Coach the open separately from therest. A weekly 30-minute session focused only onthe first 30 seconds of calls, using real recordings, will move theconnect-to-conversation rate within 2-3 weeks for most teams.
The SDR team that looks like a headcountproblem is usually a coaching problem hiding inside an aggregate metric. Theperformance variance lives in specific, fixable stages of the call. Theconversion rate that says you need to restructure is almost always telling yousomething different than what you’re hearing. The fix is upstream of thepersonnel decision, in the conversation data the aggregate metric can’t see.

The AI terminology chaos is real. Your "divide and conquer" framework is the clarity we needed.

Finally, a clear way to cut through the AI hype. It's not about the name, but the problem it solves.

