Service Level Agreements: The Metric That Rewards Theater Over Service
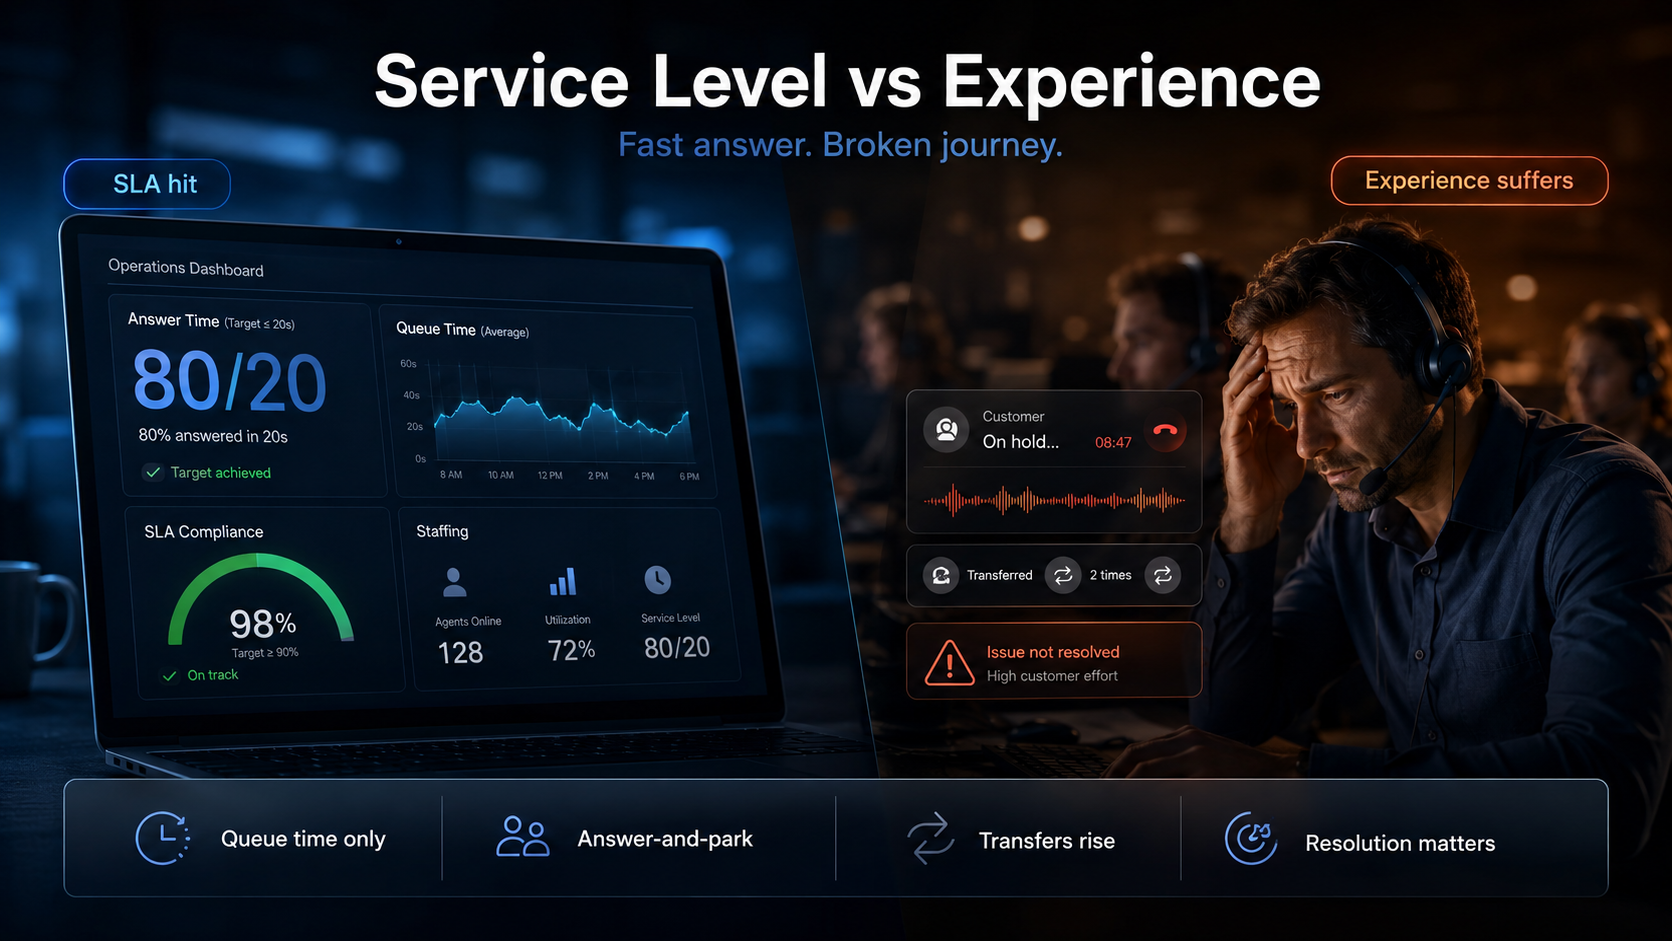
A telecom contact center we workedwith was hitting its service level agreement consistently. The standard target— 80% of calls answered within 20 seconds — was being met at 81.7% over themost recent quarter. The director of operations cited the SLA in monthlyreviews as evidence the center was operationally healthy. CSAT had beendrifting downward. Nobody in operations could explain why an organizationmeeting its service level was producing declining customer satisfaction.
We analyzed the calls that had beenanswered “within SLA.” The pattern explained the paradox. Hitting the 20-secondanswer target required staffing levels that were tight on the talk side. Onceanswered, calls were being handled by agents under cumulative pressure, withlimited time for full resolution, with frequent transfers to manage queue depthelsewhere. The customer’s experience of “being answered within 20 seconds” wasbeing followed by a call that didn’t resolve, that included a long hold, or thatended with an unsatisfying handoff. The SLA was being satisfied at the expenseof the service it was supposed to represent.
This is the structural problem withtraditional service level metrics. They measure one specific aspect of thecustomer experience — speed of initial answer — and treat it as a proxy forservice quality. The proxy and the reality diverge as soon as the operationsteam is incentivized to hit the proxy at the cost of the reality.
The dominant contact center SLA — variants of X% of calls answeredwithin Y seconds — has been the industry standard for decades. Its origins areoperational: it gives workforce management a clear target, it’s easy tomeasure, and it correlates loosely with customer experience.
What it actually measures is queue time on the inbound side, whichis one component of the customer experience and not the most important one. Acustomer answered in 18 seconds who then has a 4-minute hold mid-call and anunresolved outcome had a worse experience than a customer answered in 35seconds whose call resolved in 90 seconds total. The SLA scores the firstinteraction better than the second, even though the customer would describe thesecond as the better experience.
The metric optimizes the wrong thing. Or more precisely, itoptimizes a thing that used to correlate with the experience but has stoppedcorrelating as the failure modes have shifted.
When SLA is the dominant operational metric, predictable behavioremerges to satisfy it.
Answer-and-park. Calls get answeredquickly to satisfy SLA, then customers get put on hold while agents handleother work. The answer time is good. The customer’s experience is bad.
Transfer-to-survive. When queue depththreatens SLA, calls get transferred between teams to clear the front-linequeue. The receiving team becomes the customer’s actual experience, which isnow arriving from a different queue with different staffing.
Short staffing tolerated. Operationsleaders willing to accept tight staffing on the talk side to maintainanswer-side metrics. Customers experience this as rushed agents and unresolvedissues.
Selective metric reporting. SLA reportedon the calls that count (e.g., excluding calls abandoned within the first 5seconds, excluding calls routed to overflow). The numerator gets cleaner; thecustomer experience doesn’t change.
Each of these is technically rational under SLA-dominantmeasurement. Each of them degrades the experience the metric was supposed torepresent.
Service level isn’t useless. It’s just insufficient as a primarymetric. Organizations that take customer experience seriously have moved towardcomposite measurement that includes service level but doesn’t lead with it.
Time-to-resolution as a primary metric.How long from first contact to actual resolution, not from first ring to firsthello. This captures the experience the customer actually has.
First-call resolution as a peer metric.Whether the customer’s issue was actually resolved on the first call. SLAwithout FCR is hollow.
Customer effort score. How much work thecustomer had to do across the full interaction. This directly captures theexperience the SLA fails to represent.
Composite service experience score.Combining answer time, hold time during call, transfer count, and resolutionoutcome into a single number that reflects the customer’s actual journey. Morecomplex to compute, much more aligned with experience.
Organizations using composite measurement still track SLA — itremains useful for workforce planning — but they don’t lead with it and theydon’t reward operations leaders primarily for hitting it.
The shift away from SLA-dominance changes workforce managementsubstantially. Staffing models built to optimize answer time produce differentschedules than staffing models built to optimize resolution outcomes.
Optimizing for SLA tends to produce thin staffing with highadherence requirements. Agents need to be available exactly when calls areexpected. Cycle slack is minimal.
Optimizing for resolution outcomes tends to produce slightly heavierstaffing with more flexibility. Agents need bandwidth to complete callsproperly rather than being optimized for queue management.
The cost difference is real but smaller than operations leadersoften assume, and the customer experience difference is substantial. The tradeis usually worth it for any organization where customer experience materiallyaffects retention or revenue.
1. Cross-reference your SLAperformance with CSAT. If they’re diverging — SLAgood, CSAT declining — the metric has decoupled from the experience.
2. Measure your hold time withincalls, not just queue time. The hold time after theanswer is often longer than the queue time before it, and far less visible.
3. Calculate time-to-resolution as aprimary metric. From first contact to issueactually closed. The number will probably be higher than expected.
4. Audit your transfer rate. High transfer rates correlate with SLA optimization at the cost ofresolution. The pattern is usually visible.
5. Add at least one experience-basedmetric to operations leaders’ compensation. As longas SLA is the only metric that matters for compensation, the optimization willcontinue regardless of what other metrics get reported.
The 80/20 service level was designed toensure customers got answered promptly. Pursued in isolation, it teachesoperations to optimize for the answer at the cost of the service. The customerexperience that the SLA was supposed to represent gets worse while the SLAitself gets better, and the metric will keep saying everything is fine untilsomeone measures the things it was always missing.

The AI terminology chaos is real. Your "divide and conquer" framework is the clarity we needed.

Finally, a clear way to cut through the AI hype. It's not about the name, but the problem it solves.

