Call Center Turnover: The Cost Nobody Budgets For
Picture a 104-agent contact center whose finance team codes agent salaries under Operations, recruiter fees under HR, and training under L&D. Nobody adds them up. That total is the real cost of call center turnover at a mid-sized site, and it does not appear on a single line of the budget.
The industry has been repeating “40% attrition costs money” for a decade. It has not gone away: Metrigy projected contact center turnover at 31.2% for 2024, up from 28.1% in 2023. SQM Group’s turnover data is worse for front-line voice roles. The reason the number will not budge is not that leaders do not care. It is that the cost is diffused across four cost centers that never see the total, and every budget cycle each of those cost centers optimizes their own line without touching the underlying churn.
This post is a working model for what agent attrition actually costs a 100-agent contact center, where the money hides, and the four line items that measurably move it. It is written for VP Ops, CC Directors, and the finance business partners they have to convince.
The Real Call Center Turnover Cost Model: Four Buckets, One Total
Most turnover math you see online stops at “replacement cost per agent.” That number ($10K to $20K per McKinsey, $20,800 on average per SQM Group) is the visible part. It is roughly 30% of the total.
The full picture has four buckets, and every one of them scales with attrition:
- Bucket 1: Recruiting and Onboarding. Job board spend, recruiter time, background checks, offer letters. Averages $2,500 to $4,000 per hire in North American CC hiring markets in 2026.
- Bucket 2: Training to Productivity. Four to six weeks of paid training before an agent handles a live call at full quality. At a $22/hour loaded rate, that is $3,500 to $5,300 per hire in wages plus the trainer’s fully loaded cost.
- Bucket 3: Ramp Productivity Gap. New agents run 30% to 50% below tenured productivity for their first 90 days. On a $22/hour seat, that gap is roughly $2,900 to $4,800 per hire. This is the bucket almost nobody counts.
- Bucket 4: Supervisor Time and Team Drag. Every departure eats a supervisor’s week. Coverage falls to the remaining agents, who work overtime or degrade AHT. Estimate $1,500 to $2,500 per departure in soft costs.
Add them up. A single agent departure at a mid-market voice center costs $10,400 to $16,600 fully loaded. Take the low end, run it through Metrigy’s projected 31.2% turnover on a 100-agent site, and you are looking at $325,000 to $520,000 per year. Push it to a 40% attrition line and the range moves to $416,000 to $664,000.
The number that stops most CFOs is the ratio. For a 100-agent site that spends roughly $4.5M a year on agent wages, turnover is running at 12% to 15% of total labor cost. That is the same order of magnitude as their entire technology budget for the center, and it is not managed as a budget item.
Why Traditional Retention Programs Fail the Business Case
The standard playbook (pay bumps, referral bonuses, engagement surveys) does not survive a finance review because it cannot show attribution. A $500 pay increase across 100 agents costs $52,000 in salary alone before benefits scale it up. If it reduces turnover by 5 percentage points, it “pays for itself.” But nobody can prove it did. Attrition moves for a dozen reasons. A pay bump gets credited only if the leader championing it has enough political capital to hold the line.
This is where the retention business case has to be rebuilt. You cannot pitch a CFO “reduce turnover by 5%” as a project. You have to pitch a specific mechanism, tied to a specific bucket in the cost model, with a specific attribution signal. The four line items below meet that bar.
Line Item 1: Move Coaching From Monthly To Continuous
The math on coaching cadence is the most under-appreciated lever in the model. When a supervisor scores 2 to 5 calls per agent per month (the manual QA sampling baseline that most centers still run), a new hire receives their first substantive feedback somewhere between day 10 and day 21. In a role where 40% of departures happen in the first 90 days, that lag is the ballgame.
Continuous coaching, powered by automated quality assurance across 100% of calls, closes that gap to hours instead of weeks.
Attribution is clean because you can measure it. Track first-90-day retention rate before and after. Track average time-to-first-coaching-note. Track supervisor coaching hours per agent per week. All three move together. Finance can see the mechanism.
Line Item 2: Replace Punitive QA With Skill Gap Targeting
The second lever is what QA does when it finds a problem. In a traditional program, QA identifies a failure, logs it against the agent’s scorecard, and escalates repeat failures to a coaching plan that reads like a warning letter. Agents read this correctly as a threat. They start defending their calls instead of learning from them.
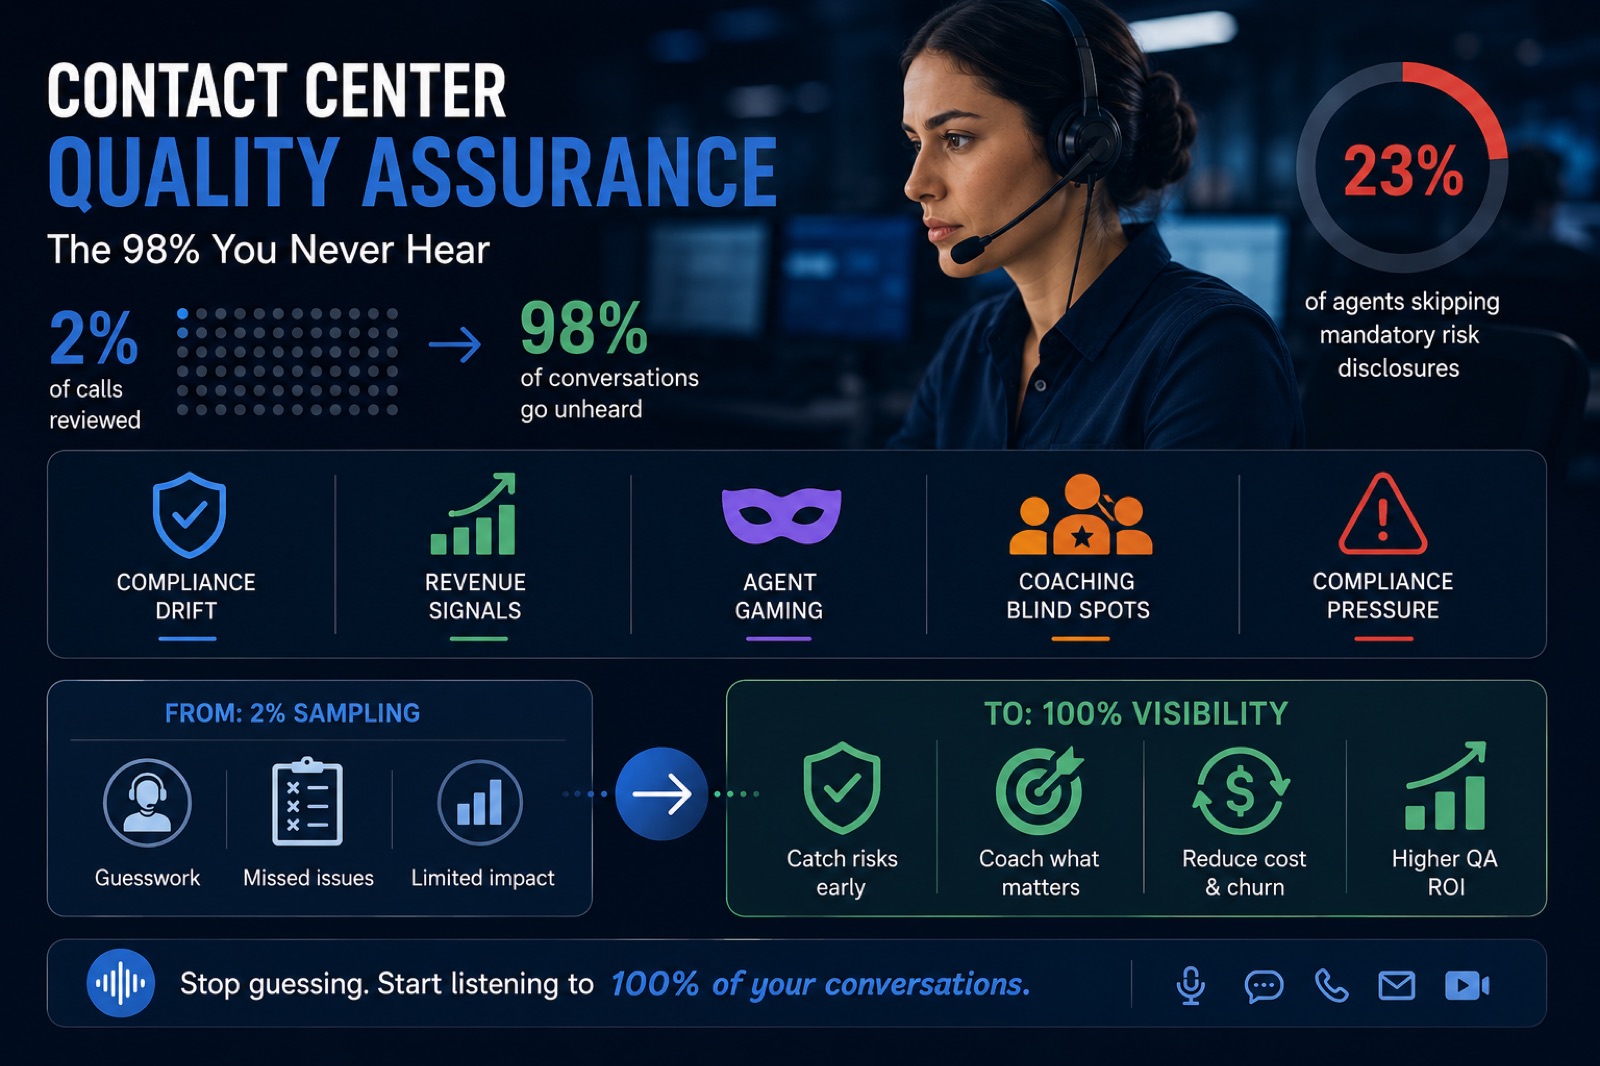
The alternative is skill-gap targeting. Instead of grading agents, AI-driven QA identifies specific behavioral patterns (empathy phrasing, hold time management, first-call resolution technique) and routes agents to short, focused learning modules for the pattern they missed. The agent sees a development pathway. The supervisor sees coverage of every call, not the 2% sample. The scorecard becomes a growth map instead of a disciplinary log.
The attribution signal here is engagement, not just retention. Track module completion rates. Track voluntary participation in self-coaching.
Line Item 3: Kill After-Call Work With Auto-Summaries
After-call work is a hidden retention killer that most operations leaders do not connect to attrition. The average voice agent spends 6 to 8 minutes on wrap-up per call. Multiply that by 40 calls per shift and you have almost 5 hours a week of typing, tagging, and CRM navigation. It is not the customers that break them. It is the eight minutes of typing after every hard call.
CRM auto-summaries generated by conversation intelligence eliminate 70% to 85% of manual wrap-up. Agents get their break back. AHT drops. CRM data quality improves because auto-summaries are more accurate than tired humans typing at the end of a shift.
The attribution is direct. Measure wrap-up time before and after. Measure agent-reported satisfaction on the two questions that matter: “Do you have enough time between calls?” and “Do you feel your after-call time is spent well?” Both move together, and both correlate to 90-day retention.
Line Item 4: Fix Onboarding Before You Fix Coaching
We have written about this before in “Agent Attrition Contact Center: The Week Two Cliff”. The short version: agents decide whether to stay by day 14, and centers do not find out until day 90. The onboarding intervention is not a longer training class. It is a shorter one plus a real coaching contact in the first ten shifts, with the coach’s context set by AI-summarized calls so the conversation is specific to the agent’s actual work.
Buffer this against the cost model. Every departure in the first 90 days loads Bucket 2 (training wages sunk) and Bucket 3 (ramp productivity never realized) at 100%. That is why first-90 attrition is the highest-leverage number in the whole model. A center that cuts overall attrition from 40% to 30% by fixing later-tenure churn saves real money. A center that cuts first-90 attrition from 25% to 15% saves multiples of that, because the sunk-cost buckets never load.
The tools that support this are the same tools already in a mature QA program. What is missing in most centers is the process: automated pull of the new hire’s first calls, coach receives a five-line AI summary, coach has a 15-minute conversation with the agent inside week two.
Cutting Call Center Turnover Across a 12-Month Budget Cycle
The point of the four line items is that each one is a discrete project with a discrete attribution signal. You do not have to sell “a retention program.” You sell one line item, prove it, and use the savings to fund the next.
A sensible order for a 100-agent site: in Q1, deploy 100% call coverage and continuous coaching; in Q2, move QA from punitive scorecards to skill-gap targeting; in Q3, enable CRM auto-summaries; in Q4, roll out the structured week-two coaching ritual. Measure each line item against its own attribution signal before you fund the next.
What To Do This Week
- Pull your first-90-day departure count for the last 12 months. Multiply by $10,400 (the low-end fully loaded departure cost) to build your board-ready baseline. Nobody at your center has this number today. Have it by Friday.
- Ask your QA lead how many calls per agent per month the team scores today. If the answer is under 10, calculate the coverage gap. This is your Line Item 1 pitch.
- Ask five agents (not supervisors) what the most frustrating part of their day is. Count how many say “the paperwork after calls.” If it is three or more, your Line Item 3 case is already written.
- Book 30 minutes with your finance business partner. Walk them through the four-bucket cost model above. The goal is not agreement on your solution, it is agreement that the current number is real. Everything else follows.
Turnover will not stop being expensive. It can stop being invisible. The centers that move first are not the ones with the biggest retention budgets. They are the ones whose CFOs finally saw the total.