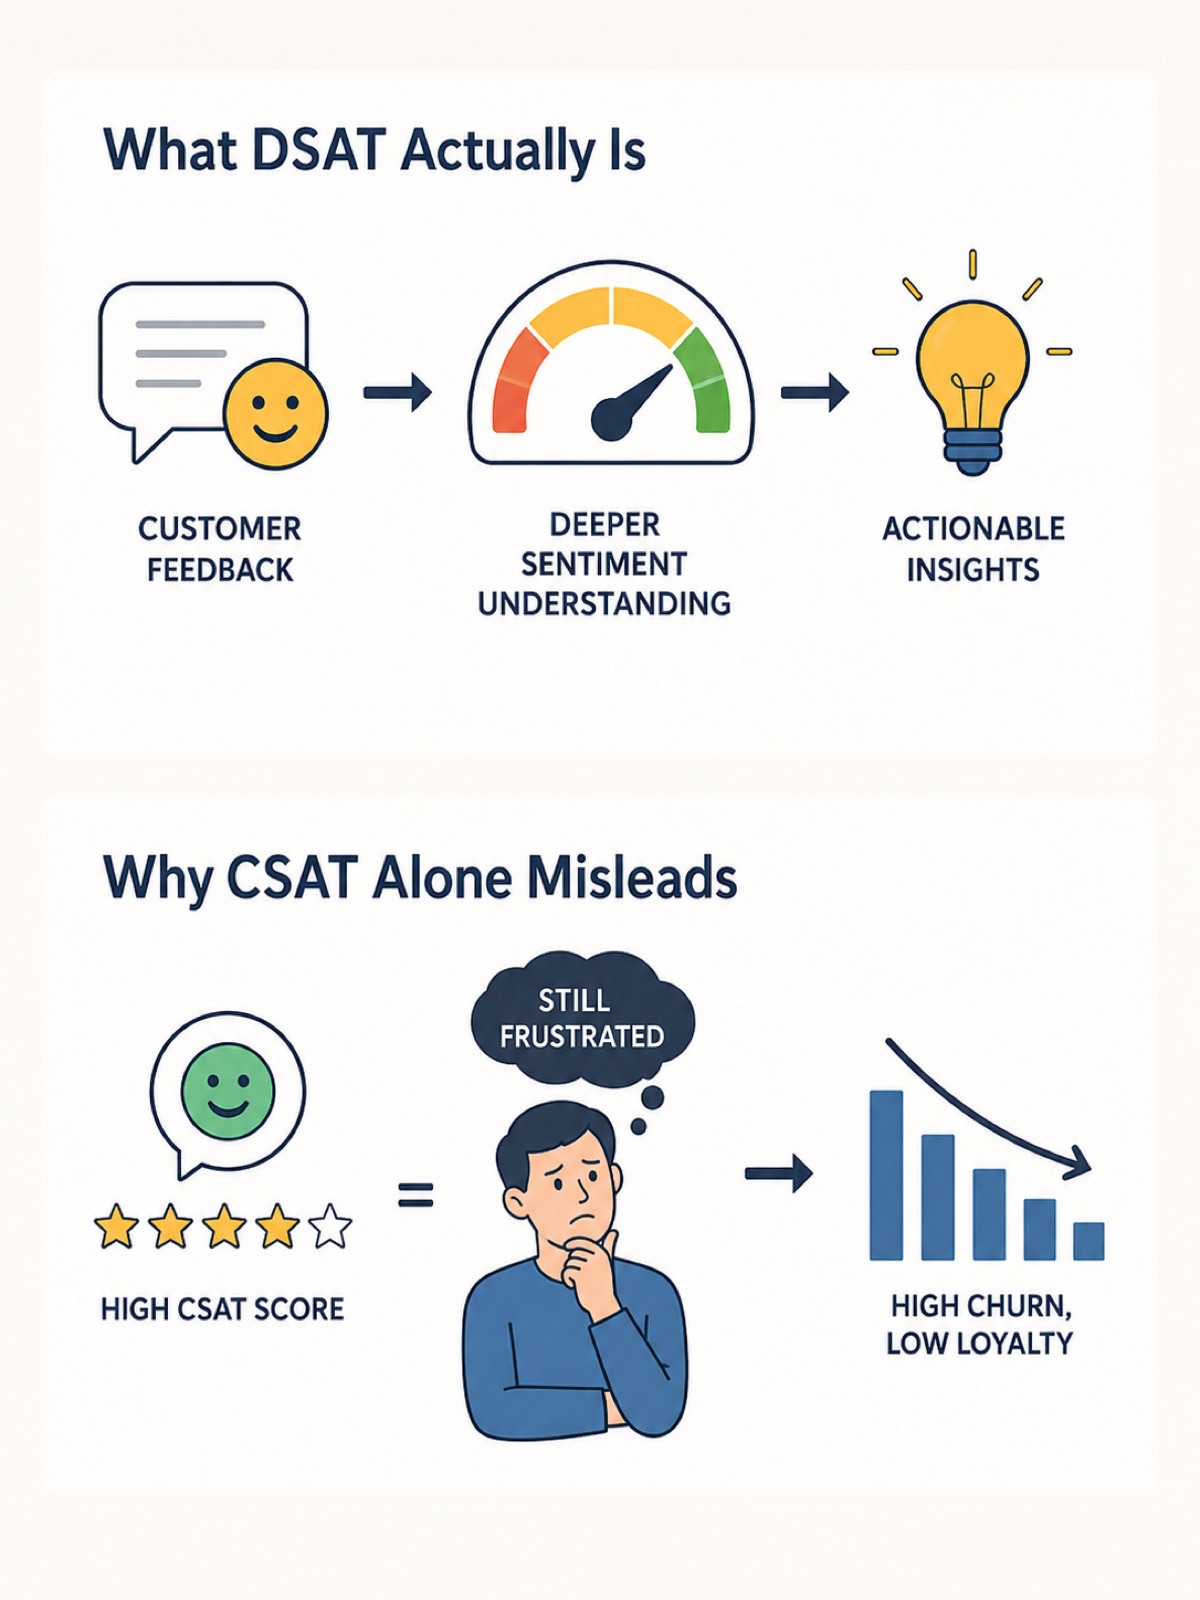
Picture a subscription business with a CSAT score of 4.3 out of 5, well above its industry benchmark. The contact center leadership team is proud of it. The customer team is less happy: churn has ticked up three quarters in a row, in a way that doesn’t match the satisfaction data.
Pull the survey responses apart at the individual level instead of looking at the average, and the picture changes completely.
In this illustrative example, the 4.3 average is held up by a strong base of 5s — 62% of respondents gave the highest rating. Another 22% gave 4s. The remaining 16% is where the story is: 1s and 2s, almost no 3s, and these are the customers who leave. The average satisfaction score looks healthy. The dissatisfaction score is a five-alarm fire that the CSAT calculation masks.
This is the central problem with treating satisfaction and dissatisfaction as opposite ends of the same scale. They’re not. They behave differently, they predict different outcomes, and they need to be measured separately to be operationally useful. DSAT (Dissatisfaction Score, or Customer Dissatisfaction) isn’t just CSAT’s mirror image. It’s a different metric that tells you a different story.
What DSAT Actually Is
DSAT is the percentage of customers who report a negative experience with a specific interaction, typically defined as a 1 or 2 on a 5-point scale, or a “bottom box” response on whatever survey scale you use. In BPO terminology, DSAT is sometimes called the “bottom-box score” or “detractor rate,” depending on which survey framework is in use.
The math is straightforward: divide the number of dissatisfied responses by the total responses, multiply by 100, and you have your DSAT percentage. A DSAT of 8% means 8 out of every 100 surveyed customers reported a clearly negative experience. Industry-average DSAT for contact centers typically runs between 6% and 12%, with significant variance by sector — telecom and utilities tend to run higher, while financial services and healthcare typically run lower.
The reason DSAT matters as its own metric, separate from CSAT, comes down to the asymmetry of customer behavior. Customers who report a 5 don’t behave like customers who report a 4. Customers who report a 1 don’t behave like customers who report a 2. The distribution is bimodal in most contact center data, and averaging across it produces a number that doesn’t match the behavior of either cohort.
Why CSAT Alone Misleads
The dominant CSAT calculation methodology — average score across responses — has structural blind spots that DSAT exposes.
The middle hides movement. If 20% of your respondents moved from 5 to 3 last quarter, your CSAT average barely moves. But you’ve just created a cohort of 20% of your customer base who are no longer enthusiastic. They’re not yet dissatisfied. They’re getting there.
The bottom matters disproportionately. Customers who report a 1 are far more likely to escalate, file complaints, write negative reviews, and tell other customers. The downstream cost of a single 1-rating customer often exceeds the lifetime value of three 5-rating customers in subscription businesses.
Response bias inflates the average. Customers who had a positive experience are systematically more likely to complete surveys than customers who had a neutral experience. The dissatisfied cohort either responds at unusually high rates (when they want to complain) or unusually low rates (when they’ve already decided to leave). Either way, the average doesn’t reflect the actual distribution.
The result is that contact centers can hit aspirational CSAT targets while simultaneously losing the customers they most needed to retain. The metric and the business outcome diverge, and leadership doesn’t see it until churn becomes undeniable.
What DSAT Surfaces That CSAT Hides
When contact centers start tracking DSAT as a peer metric to CSAT, several patterns surface consistently.
Concentration by call type. DSAT is rarely evenly distributed. One or two call types — billing disputes, technical escalations, cancellation requests — usually account for 40-60% of total DSAT volume. CSAT averages obscure this because the high satisfaction on simpler call types washes it out. DSAT cuts through and tells you exactly where the dissatisfaction is concentrated.
Concentration by agent cohort. A specific group of agents — usually 5-15% of headcount — generates a disproportionate share of DSAT responses. These agents may have average CSAT scores because they handle a lot of simple calls successfully, but their handling of difficult calls produces concentrated dissatisfaction. Traditional QA scoring misses this because the scorecard doesn’t differentiate.
Concentration by time of day. DSAT spikes at specific hours, usually correlated with staffing shortfalls or shift transitions. A Monday morning DSAT of 18% combined with a Tuesday afternoon DSAT of 4% tells an operational story that the weekly CSAT average cannot.
Concentration by tenure. New customer DSAT (in the first 90 days of the relationship) is typically 1.5-2x higher than tenured customer DSAT and predicts churn at 3-5x the rate. Onboarding-period contact center experiences are disproportionate determinants of long-term customer lifetime value.
The DSAT-Driven Operating Model
Contact centers that move from CSAT-led to DSAT-led operations tend to make four changes in sequence.
Surveying for DSAT specifically. Instead of a single CSAT survey question, the post-contact survey adds a question designed to elicit dissatisfaction directly: “What’s one thing we could have done better on this call?” with structured response categories. This produces actionable DSAT data even from customers who didn’t rate the call below 3.
Treating DSAT as a separate KPI. DSAT gets its own line on the operational dashboard, with its own target, its own owner, and its own reduction goal. Not a derived figure from CSAT. A primary metric.
Routing DSAT to root cause analysis. Every DSAT response within a defined window — usually 24-72 hours — triggers a review process. Not a callback (which sometimes helps and sometimes makes it worse), but an internal review to identify whether the dissatisfaction reflects a process failure, a knowledge failure, an agent skill gap, or a product issue. This data flows back to the relevant function for remediation.
Connecting DSAT to retention dollars. The single most powerful operational shift is putting a dollar figure on each DSAT response. A subscription business with $200 annual LTV and a 30% increased churn rate from DSAT responses can value each DSAT at roughly $60 in expected lost LTV. Now DSAT reduction has an ROI case that competes with cost-reduction initiatives on equal footing.
The Speech Analytics Connection
CSAT and DSAT both have a structural problem as customer-experience metrics: they only capture data from the customers who responded to the survey. In most contact centers, survey response rates run 8-15%. The other 85-92% of conversations don’t generate satisfaction or dissatisfaction data at all.
This is where 100% speech analytics coverage changes the equation. Conversation signals that predict dissatisfaction — frustration markers, escalation language, sentiment shifts, repeat contact patterns — can be detected on every call, not just the 10% that survey. This produces what some teams call “shadow DSAT” — a predicted dissatisfaction score for the full call volume, calibrated against the actual DSAT data from the survey cohort.
The shadow DSAT usually runs higher than the surveyed DSAT, because dissatisfied customers under-respond to surveys. The gap matters because it means most contact centers are operating with a DSAT picture that’s structurally understated.
Five Things You Can Do This Week
1. Recalculate your current CSAT as a distribution, not an average. What percentage of your respondents gave you a 5? A 4? A 1 or 2? If the bottom-box percentage exceeds 8%, you have a DSAT problem your average is hiding.
2. Add a DSAT-specific question to your post-call survey. “What’s one thing we could have done better?” with structured response categories is enough to start.
3. Identify your top three DSAT call types. Cross-reference DSAT responses against the call categorization in your CRM. The concentration will surface fast and will give you your first remediation priority.
4. Cross-reference DSAT against retention. Take last quarter’s DSAT respondents. Calculate the churn rate in the following 90 days. Compare against the churn rate of CSAT respondents from the same period. The gap will give you the financial argument for treating DSAT as a primary metric.
5. Build a shadow DSAT capability. If you have speech analytics running, instrument it to detect dissatisfaction signals on the full call volume. The gap between shadow DSAT and surveyed DSAT will tell you how much of your dissatisfaction is currently invisible.
A healthy CSAT score is not the absence of a DSAT problem. They measure different things, they predict different outcomes, and treating them as inverses of each other is one of the most expensive analytical mistakes in modern contact center operations. The customers who are about to leave are not the same customers who failed to give you a 5. They’re a different group, behaving differently, and your current survey methodology is probably telling you the wrong story about both of them.