These are the call center statistics people ask for most in 2026: benchmarks for first call resolution, handle time, speed of answer and abandonment; workforce, wage and turnover figures; what customers expect; what AI is changing; and what a call costs.
Every number is linked to the organization that measured it: a government agency, a benchmarking firm, the researchers who ran the study, or the company that published its own survey. Each one was checked at its source on October 14, 2026. A few numbers that circulate on statistics pages without a study behind them are listed near the end, with the measured figure to use instead.
Key call center statistics for 2026
- First call resolution averages 71%, and only 5% of call centers reach the world-class level of 80% (SQM Group, 2026).
- US callers waited 74 seconds on average for an agent to answer, a third longer than before the pandemic (ContactBabel, 2026).
- An inbound call costs $7.20 on average in the US (ContactBabel, 2026).
- Contact center employee attrition averaged 38% in 2025 (Deloitte Digital, 2026).
- 2,595,750 people work as customer service representatives in the US, at a median wage of $21.53 an hour (BLS, May 2025).
- US companies whose business is running call centers employed 327,500 people in 2025, down from 534,500 in 2016 (BLS).
- 74% of consumers prefer the phone for complex or urgent issues (Five9, 2025).
- 87% of customers say it is essential that a company using generative AI for service offers an option to reach a human agent (Gartner, 2026).
- Only 20% of customer service leaders have reduced agent staffing because of AI (Gartner, 2025).
- Support agents with an AI assistant resolved 14% more issues per hour on average, and novice and low-skilled agents 34% more (NBER).
- The American Customer Satisfaction Index fell to 76.1 out of 100 in the second quarter of 2026 (ACSI).
Call center benchmarks
Most operational benchmarks come from SQM Group, which benchmarks more than 500 call centers each year, and from ContactBabel's annual survey of US contact centers. Benchmarks mix industries, channels and call types, so compare each queue with its own history first.
| Metric | Benchmark | Good or top range |
|---|---|---|
| First call resolution (FCR) | 71% average | 70–79% good; 80% or more world-class |
| Average handle time (AHT) | About 10 minutes for customer service calls | Depends on the call type |
| Average speed of answer (ASA) | 74 seconds (US) | — |
| Service level | 80% of calls answered in 20 seconds | A convention, not a rule |
| Abandonment rate | 6% | Under 5% good; 3% or less at the most satisfied centers |
| Calls put on hold | 46% of calls, 55 seconds on average | 35% or less |
| Calls transferred | 19% | 15% or less |
| Customer satisfaction (top-box CSAT) | 78% | 85% or more world-class |
| Occupancy | 75–85% | Above 85% cannot be sustained for long |
| Cost per inbound call | $7.20 (US) | — |
Sources, checked October 14, 2026: SQM Group for resolution, handle time, service level, abandonment, holds, transfers, satisfaction and occupancy; ContactBabel for speed of answer and cost per call. Each figure is linked in the sections below.
First call resolution statistics
- In SQM Group's 2026 benchmark, first call resolution averages 71%, a rate of 70% to 79% counts as good, and only 5% of call centers reach the world-class 80%.
- No industry averages 80% in SQM's data: retail reaches 77%, insurance 75% and not-for-profit 73%, while technical support averages 64% and telecom 56%.
- In SQM's 2024 benchmark, general inquiries were resolved on the first call 73% of the time, billing calls 69%, technical support calls 60% and complaints 48%.
- SQM measured FCR 16% lower when customers were put on hold and 14% lower when they were transferred.
- SQM finds that for every 1% improvement in FCR, operating costs fall by 1%.
The formula, the ways to measure it and how to raise it: what first call resolution is.
Average handle time statistics
- SQM puts the industry standard at about 10 minutes for customer service calls.
- In SQM's 2024 benchmark, average handle time was 697 seconds, about 11.6 minutes including talk and wrap-up time, 18% more than the year before.
- In the same study, calls of 1 to 3 minutes reached a 3% higher first call resolution rate than calls of 5 to 10 minutes.
The formula and what moves it: AHT meaning in a call center.
Speed of answer and service level statistics
- ContactBabel's 2026 survey of 207 US organizations found an average speed of answer of 74 seconds, a third above the pre-pandemic average.
- SQM calls answering 80% of calls in 20 seconds the industry standard.
- ICMI notes that there is generally no industry-standard service level, and that 80/20 was once printed in ACD manuals as one although it never was.
- SQM research shows that, in most cases, calls answered within 120 seconds carry no customer satisfaction penalty.
Why one target does not fit every channel: call center service level.
Abandonment and hold statistics
- SQM puts the industry-standard abandonment rate at 6%; under 5% is good, and centers with great customer satisfaction stay at 3% or less.
- In SQM's data, 46% of callers are put on hold, for 55 seconds on average.
- SQM found that 19% of calls are transferred, against a good level of 15% or less.
- In Nextiva's 2025 survey of 400 people, 54% of callers hang up after at most eight minutes on hold, and 75% prefer or want a scheduled callback instead of waiting.
Customer satisfaction statistics
- SQM puts average top-box customer satisfaction at 78%; 85% or more is world-class, a level 5% of contact centers reach.
- In SQM's research, customer satisfaction is 89% when a problem is resolved in one contact and 49% when the customer has to use several channels for it.
- In Qualtrics' 2026 benchmark of 27,146 US consumers, satisfaction with a phone call to a person was 75%, against 77% for live chat and 87% for in-person service.
- In the same benchmark, an unresolved issue cut call center satisfaction by 32.6%.
- The American Customer Satisfaction Index fell to 76.1 out of 100 in the second quarter of 2026, from 76.7 in the first quarter and a peak of 78.0 in early 2024.
What an average score hides: DSAT, the metric your CSAT score is hiding.
Call center workforce statistics
There is no official count of call center agents. The US Bureau of Labor Statistics (BLS) measures the job, customer service representative, and the industry, companies whose business is running call centers. In-house call centers at banks, insurers and retailers are counted in their own industries.
- BLS counted 2,595,750 customer service representatives in May 2025, with a median wage of $21.53 an hour, or $44,770 a year.
- Telemarketers held 58,430 jobs, at a median wage of $17.04 an hour.
- BLS projects customer service representative jobs to decline 5% from 2025 to 2035, as their tasks continue to be automated, while jobs in all occupations grow 3%.
- The same projection still leaves about 289,500 openings a year, as workers move to other jobs or leave the labor force.
- Retail trade employs 15% of customer service representatives, insurance carriers 12% and business support services, which include call centers, 8%.
- US companies whose business is running call centers employed 327,500 people in 2025, down from 534,500 in 2016, and a preliminary 303,300 in August 2026.
- In ICMI's 2024 survey of 129 contact center leaders, nearly 70% of organizations ran a hybrid model, 19% were fully remote and 13% fully in the office.
- In a randomized experiment at the call center of Ctrip, a Chinese travel company, published in 2013, attrition among employees who worked from home fell by 50% against the office group, and home working raised performance by 13%.
Turnover and burnout statistics
- Contact center employee attrition averaged 38% in 2025, in Deloitte Digital's survey of 720 service leaders at large B2C companies.
- In ICMI's 2026 study, 42% of organizations reported annual turnover above 50%, and only 28% below 20%.
- In the same study, 80% of respondents said their organization had gotten better at addressing the root causes of turnover, and 78% believed their agents feel valued and supported.
- Metrigy measured contact center turnover at 21.8% in 2022 and 28.1% in 2023, and projected 31.2% for 2024.
- SQM found in 2021 that 73% of the agents who leave a call center do so in their first year.
- In Toister Performance Solutions' 2023 study of 951 contact center agents, 59% were at risk of burnout, including 28% at severe risk.
What turnover costs and where it starts: call center turnover, why new hires quit in the first year and call center burnout.
Customer expectation and channel statistics
- In YouGov's 2025 data, nearly 70% of Americans tend to use phone support and 35% prefer it, and phone calls remain the most preferred way to contact a business.
- In Five9's 2025 survey of 1,006 consumers, 56% preferred the phone for general issues and 74% for complex or urgent ones.
- McKinsey found that 71% of Gen Z respondents and 94% of baby boomers see live calls as the quickest and easiest way to reach customer care.
- ContactBabel found that 25% of US callers had tried to solve their issue online and failed.
- Gartner found that only 14% of customer service issues are fully resolved in self-service.
- Salesforce found that 77% of customers expect to interact with someone immediately when they contact a company.
- Gartner found that 87% of customers say it is essential for companies using generative AI to provide an option to reach a human agent.
- Gartner found that 64% of customers would prefer that companies did not use AI in their customer service.
- Gartner found in 2026 that only 27% of customers would try a chatbot again after a negative experience, and only 7% used a chatbot or digital assistant in their most recent service interaction.
AI in call center statistics
- COPC found that 79% of organizations use AI in customer care, and only 5% have no plans to.
- In COPC's 2025 global survey, only 44% of contact centers reported meeting their expected return on investment from AI.
- Gartner found that AI spending by customer service leaders rose 38% while overall service and support budgets grew 2%.
- Gartner's survey of 321 service leaders found that only 20% had reduced agent staffing because of AI, while 55% kept staffing stable as customer volumes grew.
- In 2022, Gartner forecast that conversational AI would reduce contact center agent labor costs by $80 billion by 2026, with one in 10 agent interactions automated, up from an estimated 1.6% in 2022.
- In 2026, Gartner predicted that generative AI's cost per resolution will exceed $3 by 2030, higher than many B2C offshore human agents.
- In a study of 5,179 customer support agents, access to an AI assistant raised issues resolved per hour by 14% on average and by 34% for novice and low-skilled workers.
- Salesforce's survey of 6,500 service professionals found that service teams estimate AI handles 30% of cases today and expect 50% by 2027.
More figures, and why so many AI projects stall: AI in customer service statistics.
Call center cost statistics
- ContactBabel puts the average cost of an inbound call in the US at $7.20 in 2026, 47% more than an email and 23% more than a web chat.
- Deloitte Digital found the average cost per assisted contact rising from $6.70 in 2024 to $7.80 in 2026.
- In a 2026 Gartner survey of 1,303 senior leaders, service and support leaders invested a median 12% of their 2025 budget in AI, the most of the 10 functions measured, yet only 24% of them showed positive financial returns.
Where the savings really are: call center cost reduction.
Call center market size statistics
Market estimates depend on what each firm counts, so read them as a range.
- Grand View Research sizes the contact center software market at $56.9 billion in 2026, growing 21.9% a year to $227.6 billion by 2033.
- Mordor Intelligence puts the contact center software market at $85.04 billion in 2026, growing to $184.24 billion by 2031.
- Fortune Business Insights estimates the call center AI market at $2.98 billion in 2026, growing to $13.52 billion by 2034.
- Mordor Intelligence sizes contact center outsourcing at $125.73 billion in 2026, with offshore centers holding a 56.71% share in 2025.
- IBISWorld puts US telemarketing and call center industry revenue at $28.2 billion in 2026, after an average decline of 2.3% a year since 2021.
More on the AI side of the market: conversational AI market size.
Call center statistics we left out
These numbers appear on many statistics pages. We could not find a study that measured them, so this page uses the measured figure instead.
- "The average speed of answer is 28 seconds." ContactBabel measured 74 seconds for US contact centers in 2026.
- "A good average handle time is about 6 minutes." SQM puts the standard at about 10 minutes for customer service calls.
- "Annual agent turnover runs 30% to 45%." Deloitte Digital measured 38% for 2025.
- "60% of callers hang up after one minute on hold." In Nextiva's 2025 survey, 54% of callers hang up after at most eight minutes.
- "88% of contact centers use AI." The IBM page it is credited to does not contain it; COPC measured 79% of organizations using AI in customer care.
Your own call center statistics, from every conversation
Industry averages show where the field is. Decisions come from your own numbers: this queue, this call reason, this month against the last one. A phone system reports how many calls came in and how long they took. It does not report why customers called, which calls came back, or where the minutes went.
Ender Turing listens to every call, chat and meeting, in any language, analyzes each one in seconds and lets you ask it anything. Its contact center operations analytics turn your own conversations into the statistics on this page:
- First call resolution from repeat calls. Each call is linked to the same customer's previous call, under your own rules for what counts as a repeat (metrics and variables).
- Handle time, taken apart. Silence share, holds and hold time, the longest monologue and waiting time, per agent, team and topic (conversations).
- Satisfaction on every conversation. AI CSAT measures satisfaction at the start and the end of every conversation, without a survey.
- Why customers call. Topics name the reason for every conversation, so volume, handle time and repeat calls break down by reason.
- Quality on every call. Automated scorecards typically reach 95%+ agreement with your own reviewers, and the accuracy-improvement workflow rewrites point definitions from those reviews.
- Reports without an analyst. Charts, C-Level Boards and scheduled email reports, or ask EnderGPT "Why did repeat calls rise last week?"
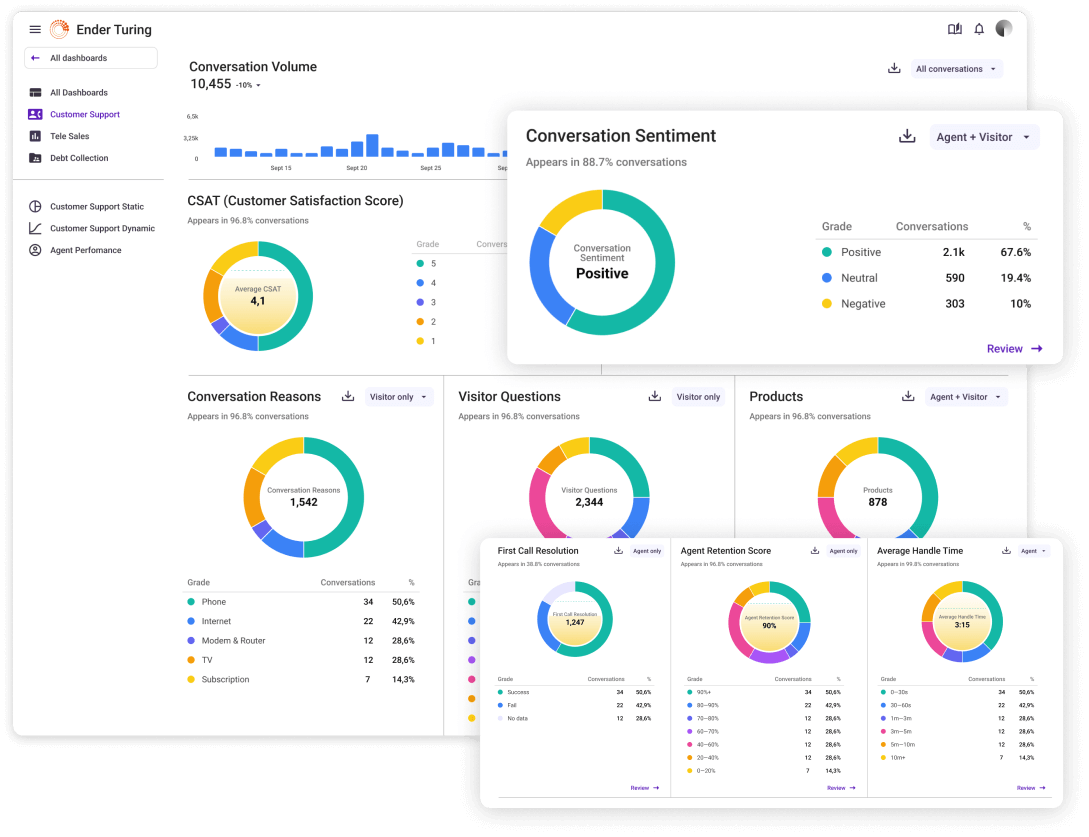
Averages across 50+ contact-center deployments: 100% of calls automatically scored versus a 3–5% manual baseline, +19% customer satisfaction, −15% average handle time, and 68 QA hours saved per specialist per month (case studies). Ender Turing is rated 4.8/5 on G2 and has a free plan for up to 5 agents: 100 calls per agent a month, calls up to 10 minutes, no expiry. Start free.
Call center statistics FAQ
How many call center employees are there in the US?
BLS counted 2,595,750 customer service representatives in May 2025, the job most call center agents hold. US companies whose business is running call centers employed 327,500 people in 2025. In-house call centers are counted in their own industries, such as banking or insurance.
What is a good first call resolution rate?
SQM Group counts 70% to 79% as good and 80% or more as world-class; the average is 71%. Compare each queue and call reason with its own history, because complaints and technical support calls are resolved less often than general inquiries.
What is the average handle time in a call center?
SQM puts the industry standard at about 10 minutes for customer service calls. Its 2024 benchmark measured 697 seconds, about 11.6 minutes including talk and wrap-up time.
What is the average turnover rate in a call center?
Deloitte Digital found contact center employee attrition averaged 38% in 2025. In ICMI's 2026 study, 42% of organizations reported annual turnover above 50%.
What are the most important call center metrics?
The ones most contact centers track, according to ICMI's survey, are abandonment rate (85% of centers), average handle time (84%), quality (77%), average speed of answer (76%) and agent productivity (74%). Add first call resolution and customer satisfaction, which show whether the customer's problem was solved. How to choose your own set: contact center KPIs.
How is productivity calculated in a call center?
Two measures are common. Occupancy is the time agents spend handling contacts divided by that time plus the time they wait for the next contact. Contacts handled per hour counts the work itself. SQM puts the standard occupancy at 75% to 85%, and occupancy above 85% is not sustainable for long.
How much does a call center call cost?
ContactBabel puts the average inbound call in the US at $7.20 in 2026. Across channels, Deloitte Digital found the average cost per assisted contact at $7.80 in 2026.
Do customers still prefer the phone?
For many issues, yes. In YouGov's 2025 data, 35% of Americans prefer phone support, and phone calls remain the most preferred way to contact a business. In Five9's 2025 survey, 74% preferred the phone for complex or urgent issues.
How much does AI save call centers?
Less than forecast so far. In 2022 Gartner forecast that conversational AI would reduce agent labor costs by $80 billion by 2026, but in COPC's 2025 survey only 44% of contact centers reported meeting their expected return on investment from AI. Gartner now expects generative AI's cost per resolution to exceed $3 by 2030.